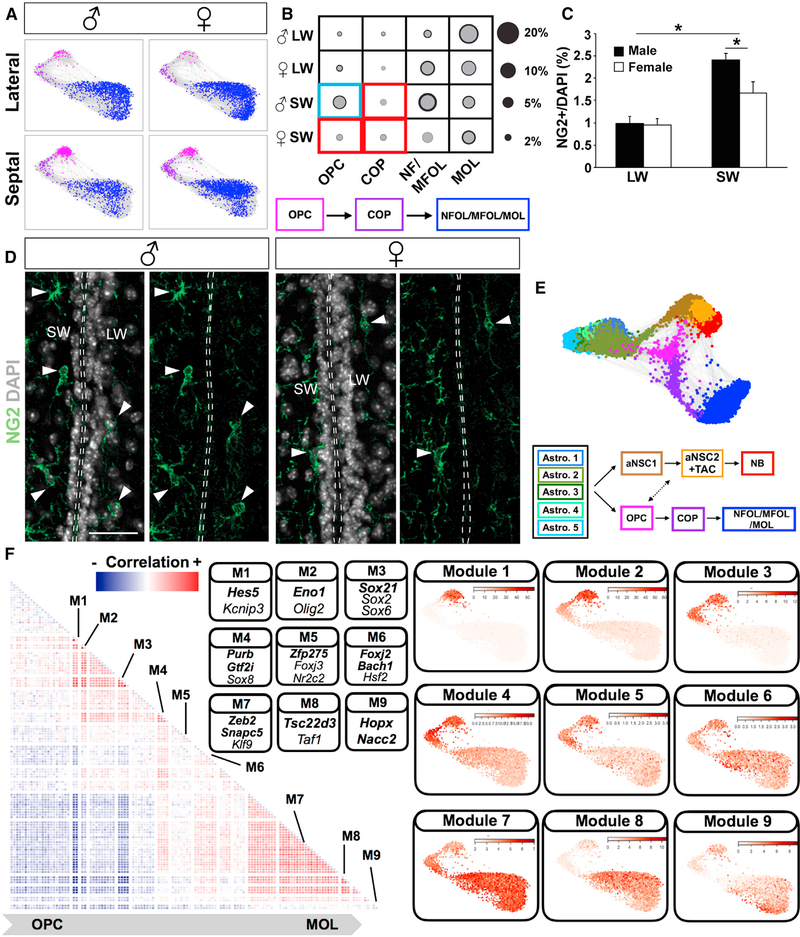
Figure 4. Regional and Sex Differences in Oligodendrocyte Lineage.
(A) Force-directed graphs showing oligodendrocyte lineage progression from OPCs to MOLs (MOL, mature oligodendrocytes; NFOL/MFOL, newly formed and myelin-forming oligodendrocytes) in four samples and a schematic summary of the lineage differentiation order.
(B) The fraction of each cell type in different samples is represented with circles (gray, mean; black, mean + SD; two biological replicates). Red box indicates regional enrichment and blue box indicates both regional and sex-specific enrichment.
(C) Quantification of NG2+ soma demonstrating sex- and region-specific differences in OPC density (%NG2/DAPI; p < 0.05; n = 3; mean + SEM). Note fibers were not quantified.
(D) Representative images of NG2 immunostainings in the V-SVZ from male and female mice. Scale bar: 50 μm.
(E) Force-directed graphs with both neuronal and oligodendrocyte lineages and a schematic summary of the differentiation order and branching point of these lineages. See also Figure S4D and Video S1.
(F) (Left) Heatmap showing correlation matrix for significant TF modules. Both axes show TFs with the same dimensionality. The correlation between the same TF was set to 0 for visualization purposes. (Right) Significant TF clusters (Figure S5B; Table S4) were ordered based on their dispersion on force-directed graphs.
The average expressions of TF modules in each cell were plotted on force-directed graphs. Modules with distinct expression patterns were separated with white lines in the heatmap. Representative TFs from different modules are shown in the panel, and TFs associated with previously undescribed co-expression patterns in each module are highlighted in bold.

