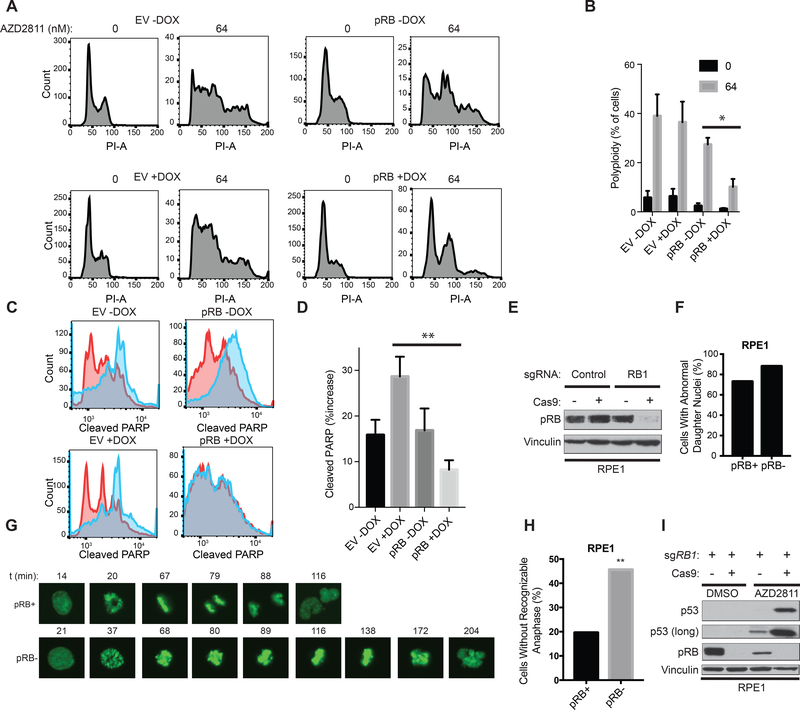
Figure 5: pRB loss exacerbates mitotic abnormalities caused by Aurora B kinase inhibition.
A-D, FACS analysis after propidium iodide (PI) staining (A) or staining with antibody against Cleaved PARP (C) of NCI-H82 RB1−/− SCLC cells that were infected with a DOX-On pRB or DOX-On EV, pretreated in the presence or absence of DOX, as indicted, for 48 hours, and then treated with AZD2811 [blue in (C)] or DMSO [red in (C)] for an additional 48 hours. B, Quantification of % polyploidy as determined by FACS of PI stained cells as in A. n=3 biological replicates. *=p<0.05 comparing pRB -DOX vs. pRB +DOX AZD2811 treated cells. D, Quantification of % increase in cleaved PARP as in C in AZD2811 treated cells relative to the DMSO controls. n=5 biological replicates. **=p<0.01 comparing EV +DOX vs. pRB +DOX AZD2811 treated cells. E, Immunoblot analysis of RPE1 cells expressing GFP-H2B and DOX-On Cas9 that were then infected with a lentivirus expressing an sgRNA targeting RB1 before being grown in the presence (pRB-) or absence (pRB+) of DOX as indicated for 24 hours. F, Quantitation of the % of cells from G that completed mitosis with an abnormally shaped daughter nuclei. G, Representative images from time-lapse fluorescence imaging of pRB+ and pRB- cells in E, that were synchronized in G2 by incubation with R0–3306 (9 μM) for 18 hours and then released into media containing AZD2811 (125 nM) for the times indicated. H, Quantification of % of cells that initiated mitosis, but failed to progress to anaphase, in cells treated as in G. n=51 mitotic cells (pRB+), n=58 mitotic cells (pRB-) from 2 biological replicates. **=p<0.01 using a two-sided chi-square test. I, Immunoblot analysis of RPE1 cells as in E, that were grown in AZD2811 (125 nM) or DMSO for 72 hours.

