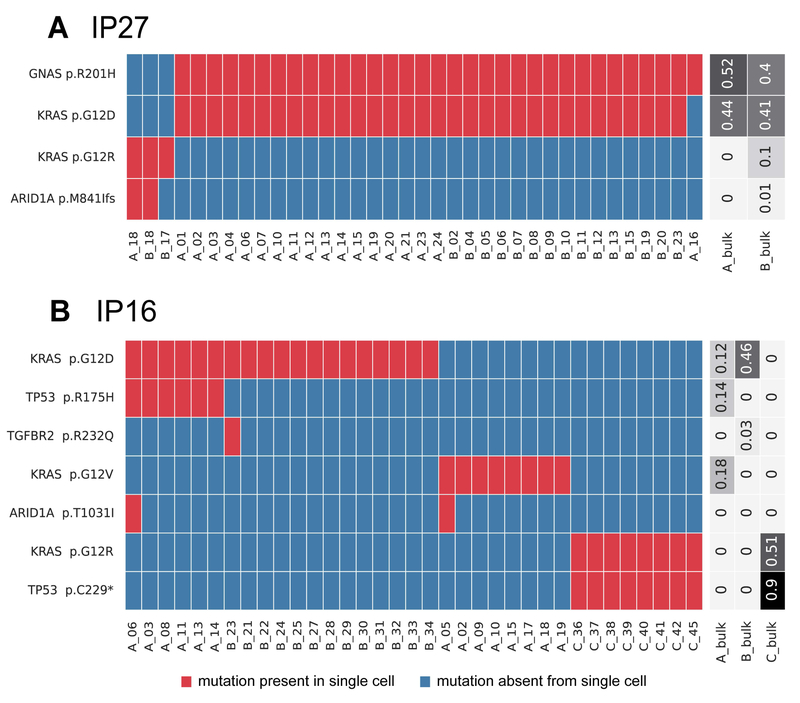
Figure 1. Somatic mutations identified in single cells from IPMNs with multiple KRAS mutations.
Somatic mutations are presented in heatmaps with each row representing a mutation and each column representing a single cell. Single cells are designated by their tissue section (A-C) and cell number. Cells and mutations were clustered with Euclidean distance bi-clustering. The colors indicate the mutation calls after imputation, with red indicating mutant and blue indicating wild-type. Variant allele frequencies of the identified mutations in bulk samples from each section are indicated on the right. Both depicted IPMNs have multiple unique KRAS mutations. The majority of cells in IP27 (A), a gastric-type IPMN with high-grade dysplasia, have p.G12D in KRAS (as well as p.R201H in GNAS), while a small subclone lacks these mutations and instead has p.G12R in KRAS. IP16 (B) represents a gastric-type IPMN (sections A and B) with an adjacent ductal adenocarcinoma (section C). In this case, the IPMN contained two unique and mutually exclusive KRAS mutations, while the cancer had a third KRAS mutation as well as a unique mutation in TP53.

