
Figure 4:
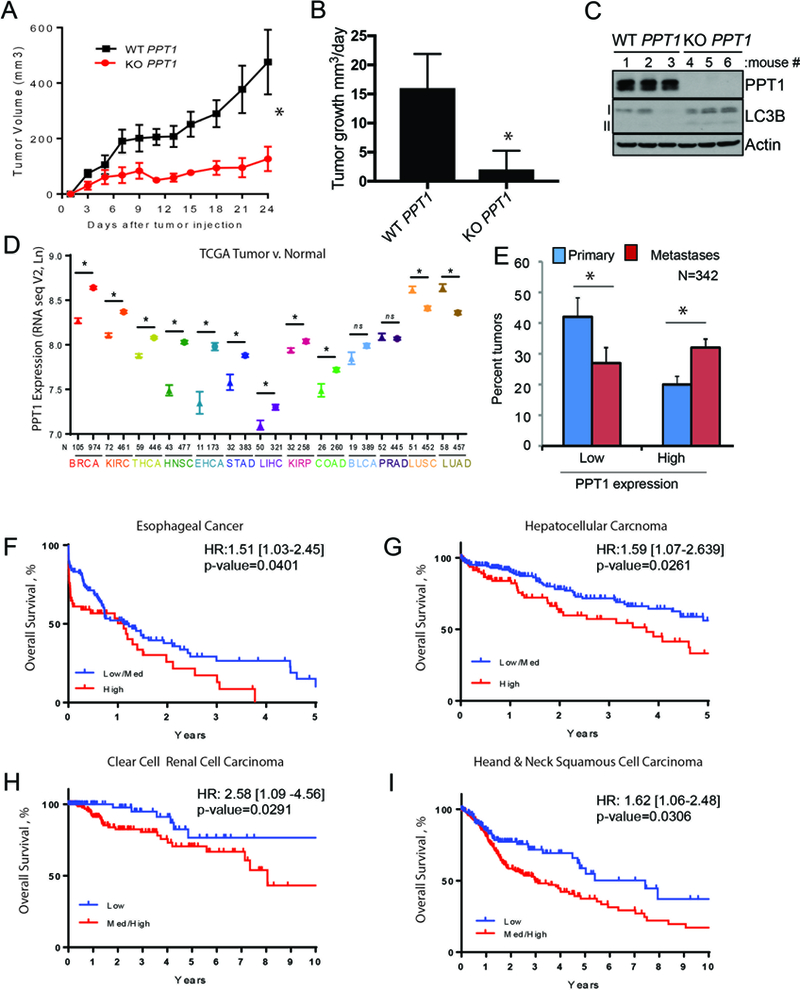
PPT1 expression is correlated with poorer patient survival. (A) WT PPT1 or KO PPT1 cells (1 × 10⁶ cells/mouse were injected into the flanks of NSG mice (n=5, each arm). Tumor volumes were measured every three days as shown. (B) Mean +/− SEM daily tumor growth rate. (C) Lysate generated from WT PPT1 or KO PPT1 cells grown in vivo were immunoblotted. (D) PPT1 expression (TCGA) in unpaired normal (symbol: triangles) and tumor samples (symbol: stars) for the following cancers: BRCA: breast cancer; KIRC: clear cell renal cell carcinoma; THCA: thyroid cancer; HNSC: head and neck squamous cell carcinoma; ESCA: esophageal cancer; STAD: gastric cancer; LIHC: hepatocellular carcinoma; KIRP: Papillary renal cell carcinoma; COAD: colon cancer; BLCA: bladder cancer; PRAD: prostate adenocarcinoma; LUSC: non-small cell lung cancer squamous cell; LUAD: non-small cell lung cancer adenocarcinoma. Mean +/− SEM is presented; *p<0.05 paired t-test. (E) PPT1 expression (TCGA RNAseqV2) in primary versus metastatic melanoma tumor samples. PPT1 values less than the 30th percentile were classified as low and values greater than the 70th percentile were classified as low. (F-I) Kaplan-Meier survival curves were computed for medium/high versus low or high versus medium/low expression of PPT1 in TCGA patients with complete RNASeqV2 expression data as well as overall survival information. Hazard ratio with 95% confidence interval and associated p-value are from a Cox regression analysis. (F) esophageal cancer, (G) hepatocellular carcinoma, (H) clear cell renal cell carcinoma, (I) head and neck cancer. Low, medium and high was defined based on tertiles for PPT1.