Fig. 5.
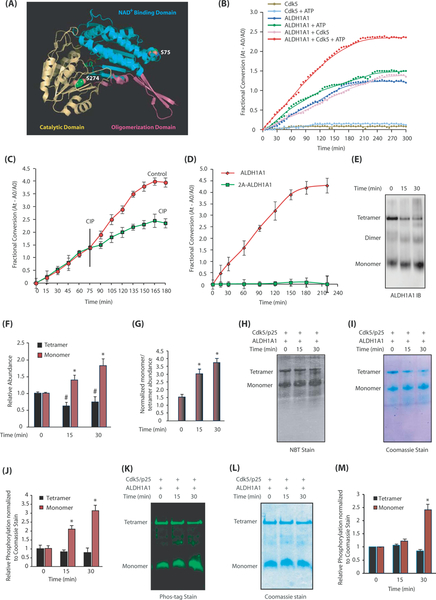
Cdk5-mediated phosphorylation of ALDH1A1 modulates its oligomeric state and dehydrogenase activity. a Monomeric ALDH1A1 displaying Cdk5 phosphorylation sites. S75 is present within the NAD+ binding pocket (shown in cyan) and S274 is part of the catalytic site (highlighted in yellow). b Cdk5 increases ALDH1A1 enzymatic activity. Comparative spectrophotometric analysis of ALDH1A1 activity upon phosphorylation by Cdk5. ALDH1A1 activities with and without ATP and Cdk5 were used as controls. c Dephosphorylation of ALDH1A1 by calf-intestinal alkaline phosphatase (CIP) decreases its dehydrogenase activity. Each experiment was done at least three independent times. Representative data are shown. d ALDH1A1-phosphorylation-dead mutant have minimal enzymatic activity. e Phosphorylation of ALDH1A1 by Cdk5 triggers ALDH1A1 oligomers to dissociate to the monomeric form. f Average relative changes in tetramer and monomer abundance derived from three independent experiments. The intensities of tetramer and monomer at each time were normalized independently against time 0. *p < 0.05 versus monomer and#p < 0.05 versus tetramer at 15 and 30 min, respectively, from three independent experiments. g Average ratio of normalized monomer to tetramer as a function of time. To account for the large difference in tetramer and monomer abundance, the intensity of each band was normalized against the tetramer intensity at time zero and the ratio of monomer to tetramer was plotted as a function of time (*p < 0.05 at 15 and 30 min). h Activity staining of phosphorylation-induced ALDH1A1 monomer harbors high dehydrogenase activity. i Coomassie G-250 stain of h. j Quantification of oligomer-specific ALDH1A1 activity from three independent experiments (*p < 0.05 at 15 and 30 min) analyzed by two-way analysis of variance. Specifically, monomer and tetramer intensities of activity and Coomassie stain at 15 and 30 min of phosphorylation were normalized against the unphosphorylated tetramer control (basal activity); then, the normalized activity of each oligomer was divided by its respective normalized Coomassie signal to generate the plot. k Phos-tag staining of phosphorylated ALDH1A1 separated using native gel. l Coomassie G-250 stain of k. m Quantification of normalized Phos-tag intensities with respect to total protein levels from three independent experiments. Protein quantification was carried out in the same way as described for the activity assay (*p < 0.05 for monomer at 0 and 30 min analyzed by two-way analysis of variance). The green color denotes phosphorylation-specific signal

