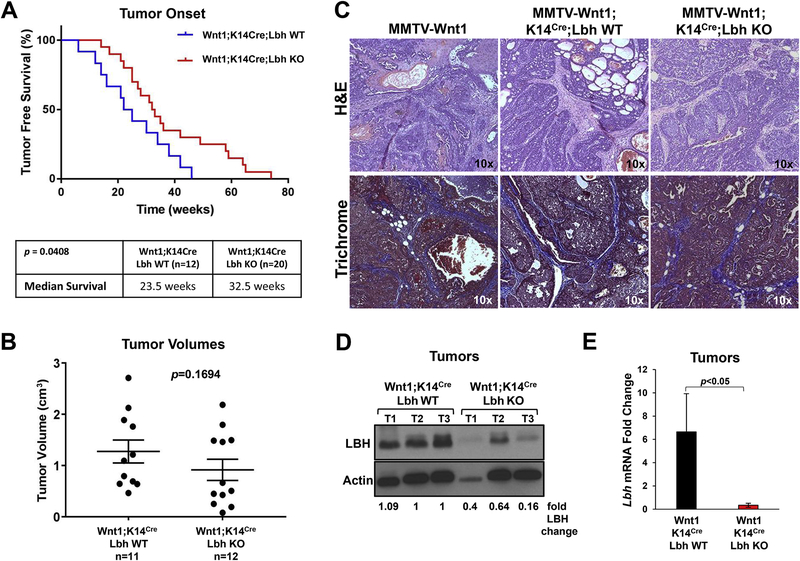
Figure 4: Loss of LBH delays tumor onset in MMTV-Wnt1 transgenic mice.
(A) Kaplan-Meier analysis of tumor-free survival. Cohorts of virgin female MMTV-Wnt1;K14Cre;Lbh wild type (WT) (n=11) and MMTV-Wnt1;K14Cre;Lbh knockout (KO) (n=20) mice were palpated weekly for tumor formation and biweekly, once tumors had formed. Table (bottom) shows significant differences in the median survival between the two study groups (p=0.0408; log-rank test). (B) Mann-Whitney analysis comparing tumor volumes in the same study groups at tumor onset: n=11 for MMTV-Wnt1;K14Cre;Lbh WT and n=12 for MMTV-Wnt1;K14Cre;Lbh KO. P-value as indicated. (C) Representative H&E- and Masson’s Trichrome-stained mammary tumor sections (magnification: 10x) from trigenic MMTV-Wnt1;K14Cre;Lbh WT and MMTV-Wnt1;K14Cre;Lbh KO mice vs. parental MMTV-Wnt1 transgenic mice. (D) Western Blot analysis of LBH expression in Wnt1;K14Cre;Lbh WT and Wnt1;K14Cre;Lbh KO tumors (T) (n=3 each). Actin served as loading and normalization control for the densiometric quantification of the fold changes of LBH protein levels relative to control tumors (T1, T2; lanes 2, 3). (D) qPCR quantification of Lbh mRNA levels in Wnt1;K14Cre;Lbh KO vs. Wnt1;K14Cre;Lbh WT mammary tumors (n=3/genotype; triplicate samples; one way ANOVA). Data normalized to Gapdh represent the mean ± s.e.m.; p<0.05.

