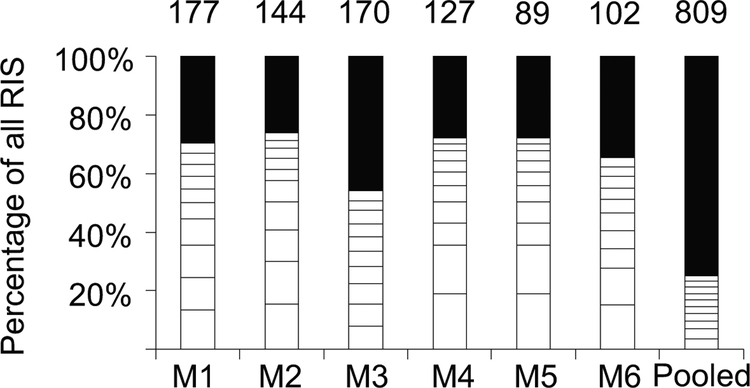
Figure 4.
Clonality analysis of foamy viral vector FV-EGW-A1 proviral integrations in vivo. Each bar represents the clonal composition in the bone marrow of individual mice. The last bar represents the combined analysis for the pooled integrations from all of the mice. The white boxes depict the top ten clones with the highest span counts for each mouse. The number on top of each bar represents the total number of unique integrations. RIS is retroviral integration site, M is mouse.

