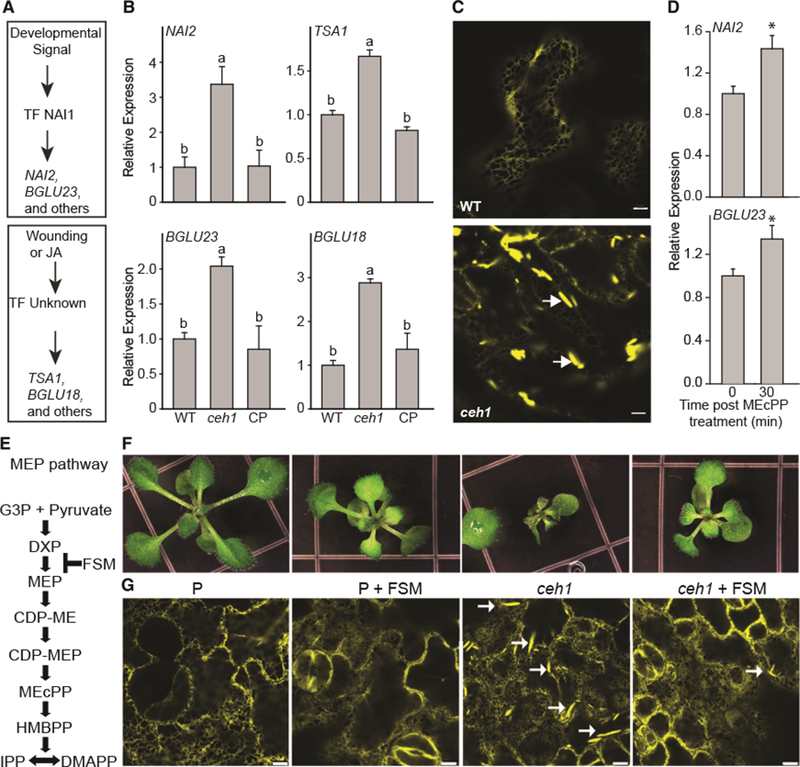
Figure 1. Stress-lnducible ER Bodies Are Constitutive in the ceh1 Mutant.

(A) Depiction of ER body marker genes induced by developmental or stress signals.
(B) Relative expression levels of genes regulated by developmental (NAI2 and BGLU23) and stress (TSA1 and BGLU18) signals, in WT, ceh1, and ceh1 complemented (CP) lines. Total RNA extracted from these genotypes was subjected to real-time qPCR analysis. The transcript levels were normalized to At4g26410 (M3E9) measured in the same samples. Data are the mean fold difference ± SD of three biological replicates each with three technical repeats. Different letters represent statistically significant differences (p < 0.05). p values were determined by Student’s t-test.
(C) Representative confocal images of WT and the ceh1 mutant rosette leaves depicting constitutive presence of otherwise wound-inducible ER bodies exclusively in ceh1. White arrows show the ER body. Bars, 5 μm.
(D) Relative expression levels of genes in WT plants treated exogenously with MEcPP. The transcript levels were normalized to At4g26410 (M3E9) measured in the same samples. Data are the mean fold difference ± SD of three biological replicates each with three technical repeats. Asterisks show the statistically significant differences relative to time 0 (p < 0.05). p values were determined by Student’s t-test.
(E) Schematic presentation of the MEP pathway depicting the site of fosmidomycin (FSM) action.
(F and G) Representative images of seedlings (F) together with the confocal images depicting ER body structure selectively shown by white arrows (G), grown in the presence (+) or absence (−) of FSM. Bars, 5 μm.
