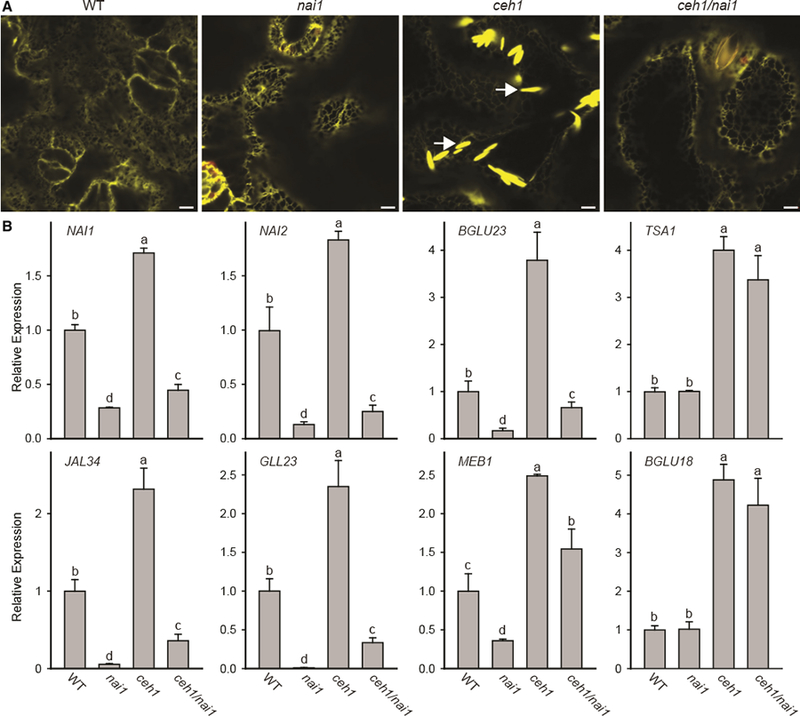
Figure 3. ER Body Formation in the ceh1 Mutant Is NAI1 Dependent.

(A) Representative confocal images of WT, nai1, ceh1, and ceh1/nai1 leaves depicting the NAI1-dependent constitutive presence of otherwise wound-inducible ER bodies the in ceh1 mutant background. White arrows show the ER body. Bars, 5 μm.
(B) Relative expression levels of ER marker genes in the aforementioned genotypes. Total RNA extracted from these genotypes was subjected to real-time qPCR analysis. The transcript levels were normalized to At4g26410 (M3E9) measured in the same samples. Data are the mean fold difference ± SD of three biological replicates each with three technical repeats. Different letters represent significant differences (p < 0.05). p values were determined by Student’s t-test.
