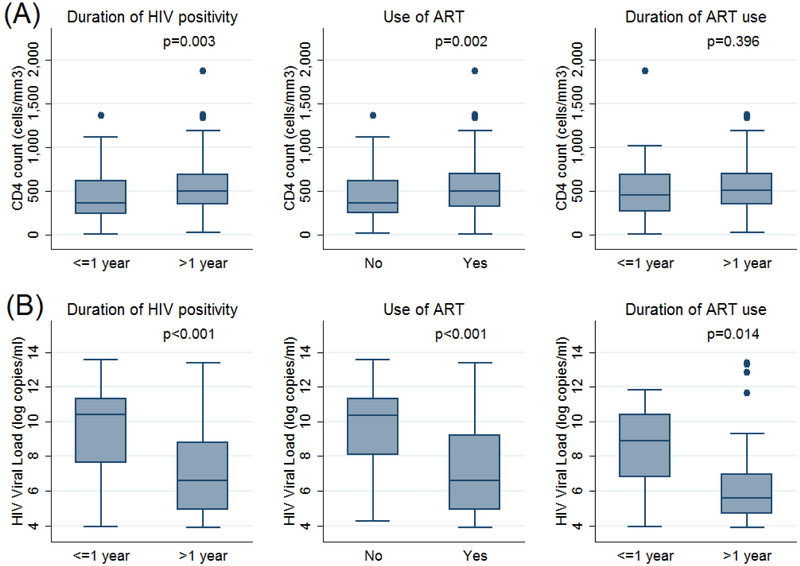
Figure 1:
CD 4 count and HIV viral load. Box and whisker plots of CD 4 cell counts (cells/mm3) and HIV viral loads (log copies/ml) categorized by duration of HIV seropositivity, use of ARTs and the duration of ART use. Boxes represent interquartile ranges with the median line drawn. Outliers are shown as dots. p-values were calculated using the Mann Whitney test.

