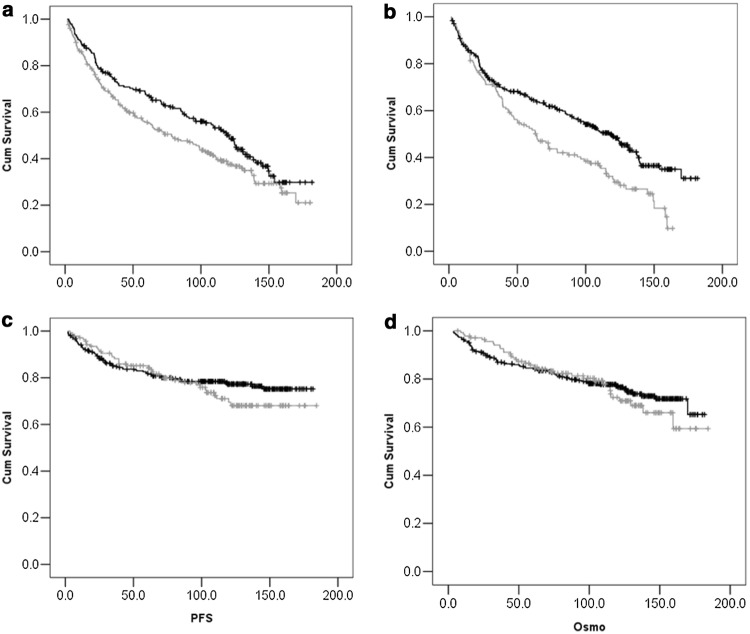
Fig. 2.
Factors affecting EFS. a shows the difference between EFS among those with low risk (black line) and high risk (gray line) Hasford scores at baseline. b shows the difference in EFS between those who were adherent (black line) and non-adherent (gray line) to therapy. c and d shows the difference in PFS(2c) and OS (2d) among those who were adherent and non-adherent to therapy respectively

