Figure 2.

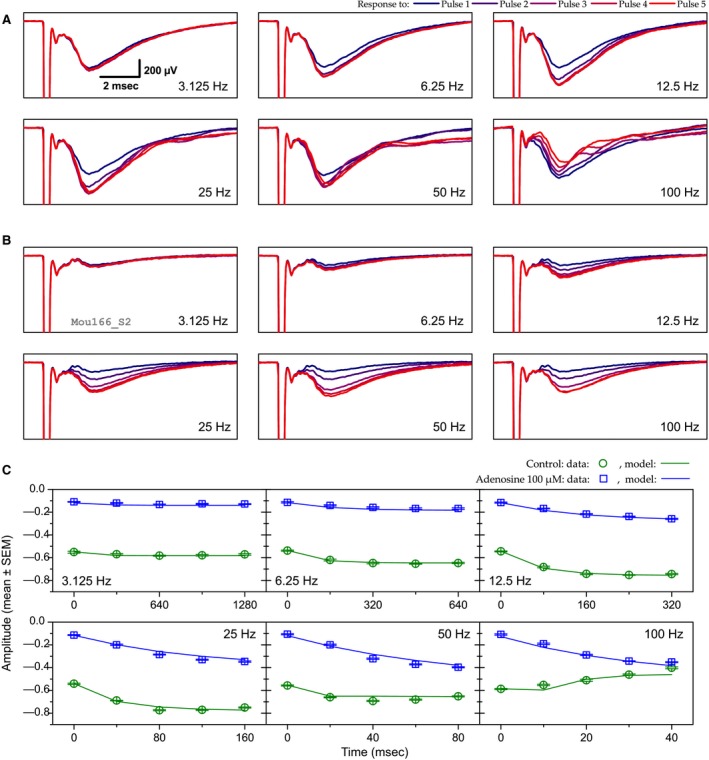
Example of the effect of adenosine (100 μmol/L) on short‐term synaptic plasticity. (A and B) The six panels in A and B correspond to the six stimulation frequencies (from 3.125 to 100 Hz). Each panel shows the mean LFP trace for each of the five consecutive stimuli of a stimulation train at a given frequency. Pulse ranks are color coded from the first one (blue) to the fifth one (red). Results obtained in the control condition and in the presence of adenosine 100 μmol/L are represented in A and B, respectively. Scale in the 3.125 Hz panel in A applies to all other panels. (C) Peak N‐wave amplitude (in mV) as a function of stimulus timing and frequency. Points represent the mean experimental data (error bars denote ±1 SEM) while solid lines represent STP model fits. Green symbols and lines correspond to control situation and blue ones to adenosine 100 μmol/L. Model parameters: shared parameter, E = 1.957. Control: U = 0.509, τ F = 151 msec, k = 1, τ R1 = 19 msec; adenosine 100 μmol/L: U = 0.11; τ F = 184 msec; k = 1; τ R1 = 11 msec. RMSE = 0.032.
