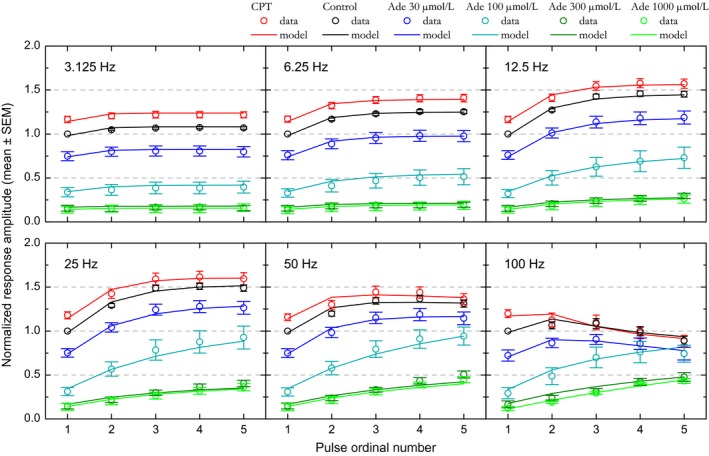
Figure 4.

Effect of adenosine and CPT on short‐term synaptic plasticity at the population level. CPT (adenosine A1 receptor antagonist) and different extracellular adenosine concentrations (30, 100, 300, and 1000 μmol/L) have been tested. Relative amplitudes associated with each condition are plotted as a function of stimulation pulse rank and of stimulation frequency. Experimental data are represented by the colored dots. Error bars represent the SEM. The means of the values predicted by the STP model are represented by colored solid lines. SEM values for model predictions were similar to those for experimental data and are not shown for alleviating the figure.
