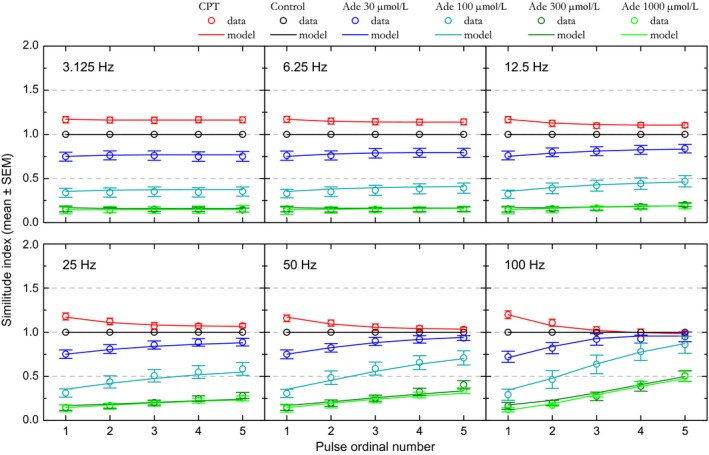
Figure 5.

Changes in “similitude index” indicate that short‐term synaptic plasticity counteracts adenosine inhibition at high stimulation frequency. The similitude index corresponds, for a stimulus of order n, to the ratio of N‐wave amplitude in a given condition (adenosine or CPT) divided by the control N‐wave amplitude. Similitude indices associated with each condition are plotted as a function of stimulation pulse rank and stimulation frequency (3.125–100 Hz). Colored dots indicate the means for the different tests (CPT and adenosine at 30, 100, 300, and 1000 μmol/L). Error bars represent the SEM. Continuous lines represent the mean similitude index calculated from values predicted by the STP model. SEM values for model predictions were similar to those for experimental data and are not shown for alleviating the figure.
