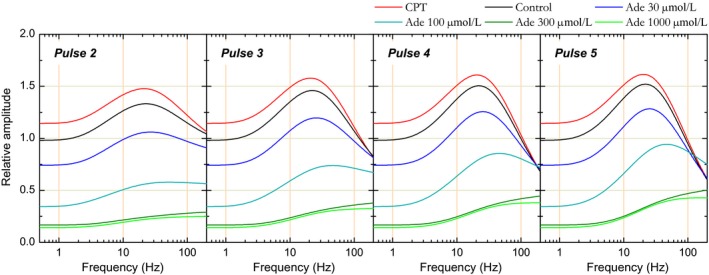
Figure 10.

Simulation of relative response amplitude as a function of stimulation frequency reconstructed from short‐term plasticity model parameters in the different conditions and for each consecutive stimulation pulse. Simulations were first produced for each experimental condition and each stimulation pulse using model parameters issued from each individual case. Simulations pertaining to the same stimulation pulse and to the same experimental condition were then averaged and the corresponding curves are presented in the figure: panels correspond to pulses 2–5 and the different lines in each panel to the different experimental conditions (CPT, control, and adenosine 30–1000 μmol/L).
