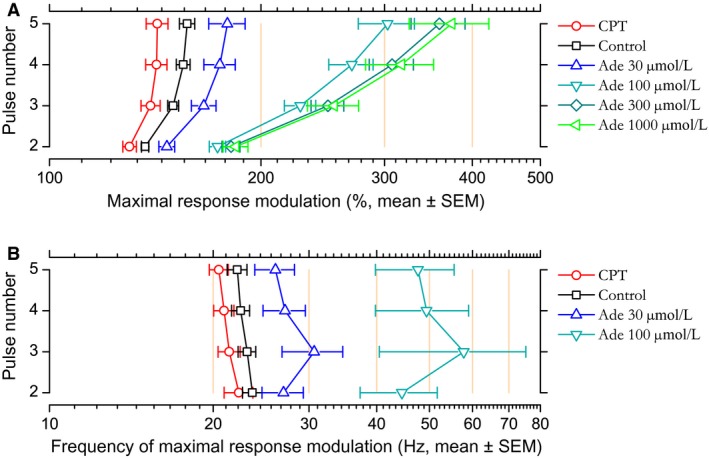
Figure 11.

(A) Maximal response modulation in CPT, control, and different adenosine concentrations. Maximal response modulation was extracted from individual simulation of STP calculated using parameters of the model fitted to each individual case. Dots correspond to the means calculated for each consecutive stimulating pulse and error bar represent the SEM. (B) Frequency at which maximal response modulation occurred (mean ± SEM). This frequency could not be determined for simulations that lacked a peak followed by a decline for frequencies ≤200 Hz. As a consequence, reduced sample sizes precluded showing frequency data for adenosine 300 and 1000 μmol/L.
