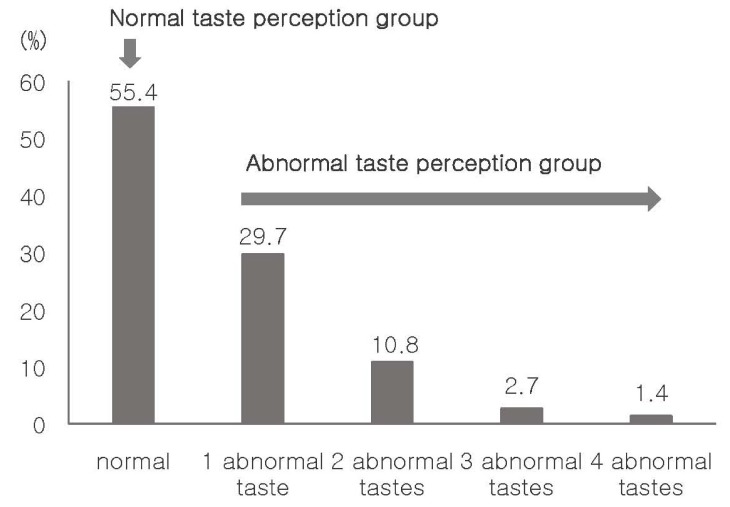
Fig. 1. Distribution of normal/abnormal taste perception groups.
1 abnormal taste: sweet taste or salty taste or sour taste or bitter taste
2 abnormal tastes: sweet taste and salty taste or sweet taste and sour taste or sweet taste and bitter taste or salty taste and bitter taste
3 abnormal tastes: sweet taste and salty taste and bitter taste or sweet taste and sour taste and bitter taste
4 abnormal tastes: all tastes

