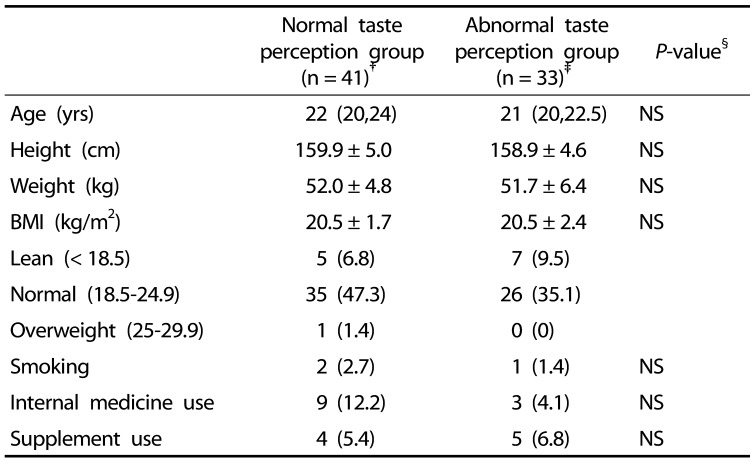
Table 1. Basic characteristics of normal and abnormal taste perception groups.
Values are shown as medians (25th percentiles,75th percentiles) or Mean±SD deviation or number (%)
BMI, body mass index; NS, not significant
†Normal taste perception group: normal range of all four basic tastes (sweet, salty, sour, and bitter)
‡Abnormal taste perception group: more than 1 abnormal taste perception regardless of flavor
§Differences between normal taste perception group and abnormal taste perception group were compared using Mann-Whitney U-test and Unpaired t-test for continuous variables and categorical variables for Chi-squared test

