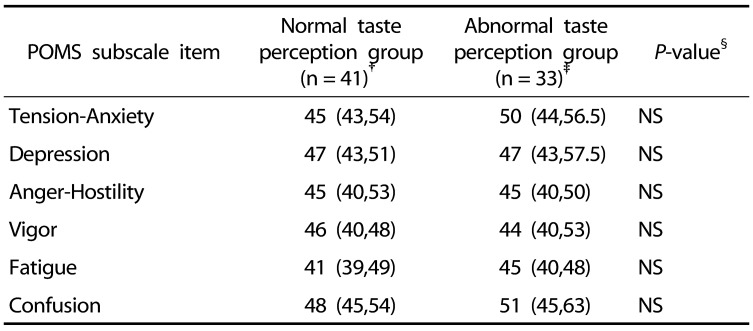
Table 3. Comparison of each mental health score between normal and abnormal taste perception groups.
Values are shown as medians (25th percentiles,75th percentiles)
POMS, profile of mood states; NS, not significant
†Normal taste perception group: normal range of all four basic tastes (sweet, salty, sour, and bitter)
‡Abnormal taste perception group: more than 1 abnormal taste perception regardless of flavor
§Differences between normal taste perception group and abnormal taste perception group were compared using Mann-Whitney U-test

