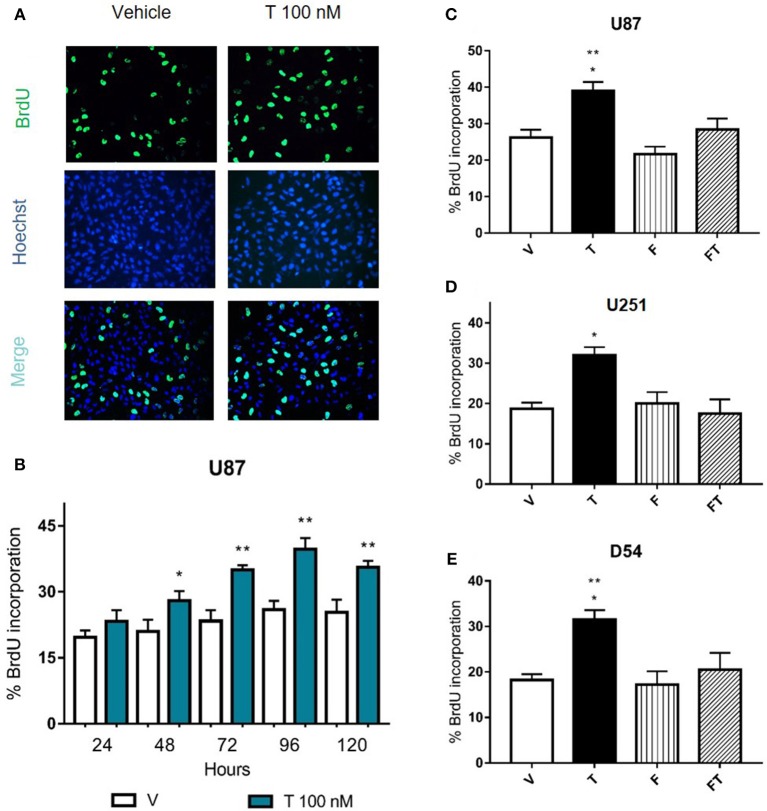
Figure 3.
Effects of flutamide on GBM cell proliferation. (A,B) Cell proliferation was measured after the treatment of testosterone (T 100 nM) during 24, 48, 72, 96, and 120 h in GBM cells by the BrdU incorporation assay. (A) Representative immunofluorescence images (400X magnification) of BrdU-positive U87 cells (upper panel), cell nuclei (Hoechst stain, middle panel), and merge (lower panel) are shown. (B) Graph represents the percentage of U87 cells incorporating BrdU. Each bar indicates the mean ± SD, n = 4. *p ≤ 0.05, **p ≤ 0.01 T vs. vehicle (V). (C–E) AR antagonist flutamide (F 5 μM) blocks the increase in cell proliferation induced by T. Graphs show cell proliferation of U87 (C), U251 (D), and D54 (E) cells treated 78 h with V, T, F, and F plus T (FT). Each bar indicates the mean ± SD, n = 4. *p ≤ 0.05 vs FT; **p ≤ 0.01 vs V and F.

