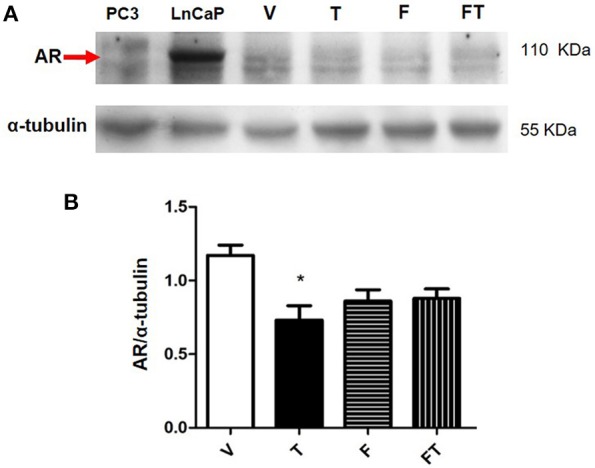
Figure 6.

Expression of AR in U87 cells. (A) Results obtained from Western blot of PC3 (negative control), LnCap (positive control), and U87 cells treated with vehicle (V), testosterone (T 100 nM), flutamide (F 10 μM), and F plus T (FT), during 24 h. (B) Graph represents densitometric analysis of the experiments. Each bar indicates the mean ± SD, n = 4. *p < 0.05, T vs. V.
