Figure 1.
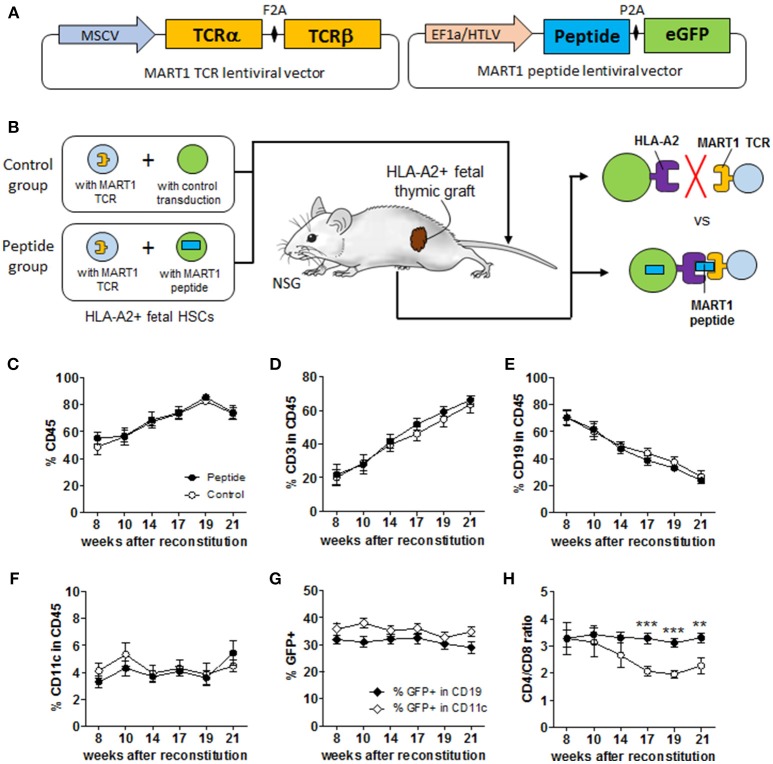
Experimental scheme and immune reconstitution of humanized mice. (A) Simplified overview of MART1-TCR and MART1 peptide-expressing lentiviral vectors. (B) Experimental scheme of the MART1 model depicting the characteristics and expected outcomes of the Control and Peptide groups. Flow cytometric determination in the blood at different time points after HSC and thymic implantation of: (C) % human CD45+ cells, (D) % CD3+ T cells, (E) CD19+ B cells, and (F) CD11c+ cells among CD45+ cells. (G) % of GFP+ (MART1 peptide-expressing cells) among CD19+ and CD11c+ cells measured in the Peptide group. (H) D4/CD8 ratio measured from total CD8+ and CD4+ T cells. All graphs show the mean ± SEM from Control group (open circles, n = 9) and Peptide group (closed circles, n = 8). Data were pooled from two independent and highly reproducible experiments. No significant differences were seen between the two groups by two-way ANOVA; panel H shows significant differences by t-test analysis.

