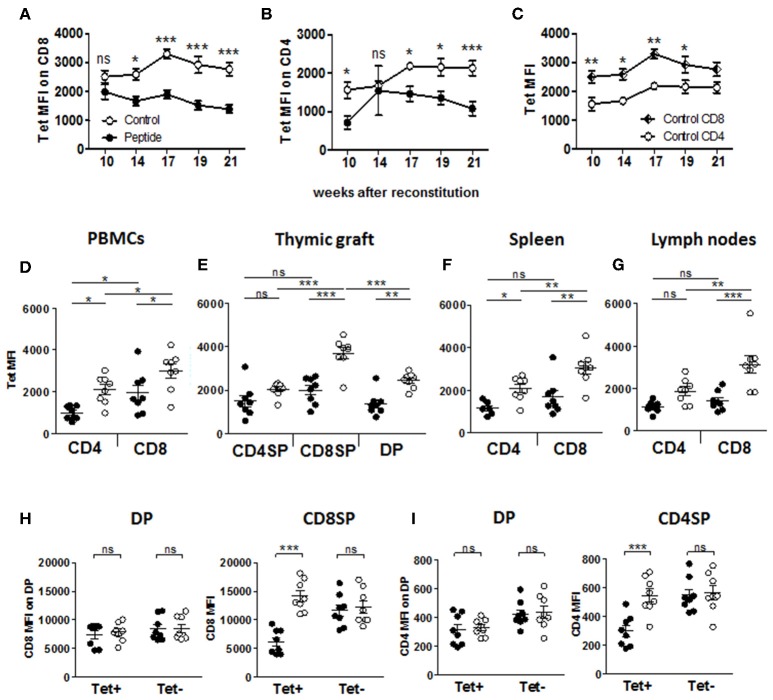
Figure 4.
Expression of the TCR and accessory molecules CD4 and CD8. (A–C) Flow cytometric of MART1-TCR level by mean fluorescence intensity (MFI) of tetramer staining in Tet+ CD8+ T cells (A) and Tet+ CD4+ T cells (B) comparing Control vs. Peptide groups, and in Control group (C), comparing CD8+ and CD4+ Tet+ T cells at different time points after reconstitution (mean ± SEM, peptide n = 8, control n = 9). (D–G) Tetramer staining MFI of Tet+ T cells from PBMCs (D), thymic graft (E), spleen (F), and (lymph nodes (G) at end point (mean ± SEM, peptide n = 8, control n = 8). (H) CD8 expression (MFI) on single and double-positive Tet+ and Tet− CD8+ T cells in thymic graft. (I) CD4 expression (MFI) on single and double-positive Tet+ and Tet− CD4+ T cells in thymic graft. All panels: filled and open circles depict mice from Peptide and Control groups, respectively.

