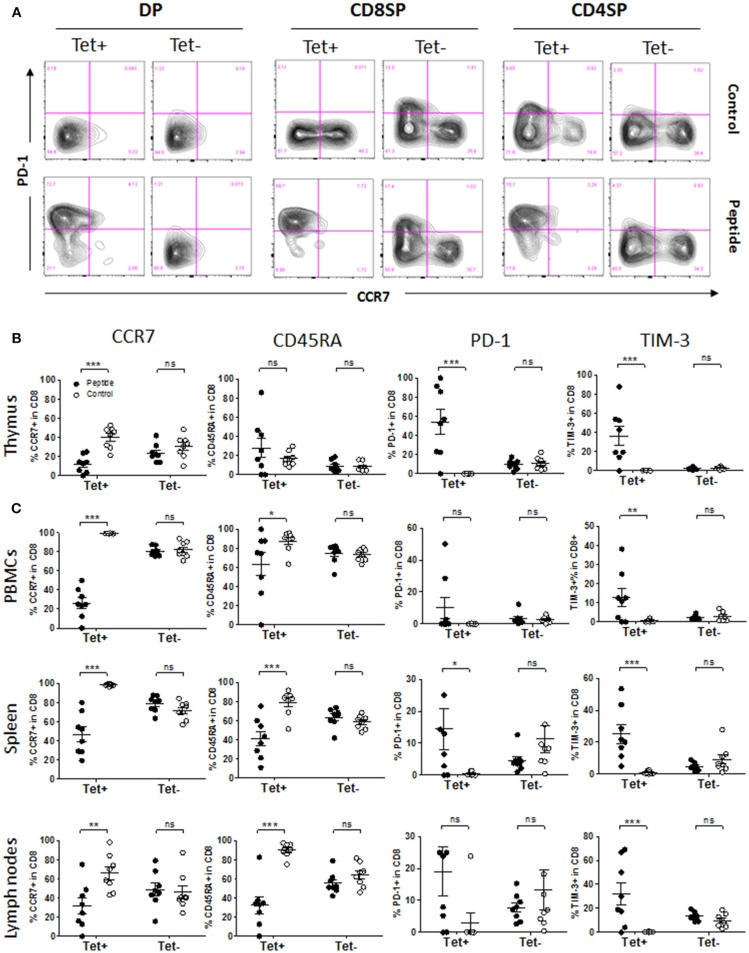
Figure 5.
Phenotype of MART1-reactive T cells in the presence or absence of antigen. (A) Representative flow cytometry plots of CCR7 vs. PD-1 staining on Tet+ and Tet− cells among DP, CD8SP, and CD4SP thymocytes from Control group (upper row) and Peptide group (lower row) at end point. (B,C) Percentage of CCR7+, CD45RA+, PD-1+ and TIM-3+ cells among Tet+ CD8+ and Tet− CD8+ T cells from Control group (open circles) and Peptide group (filled circles) in thymic graft (B), PBMCs, spleen, and lymph nodes (C) at end point (mean± SEM, n = 8 mice per group).

