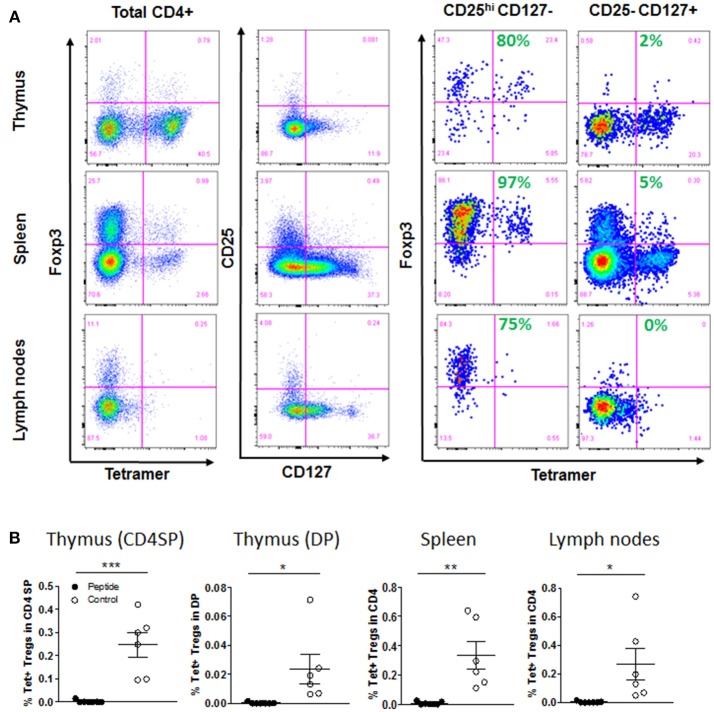
Figure 6.
Selection of regulatory T cells. (A) Gating strategy for thymic, spleen and lymph node Treg cells populations, after first gating on live, singlet, CD45+, CD3+, and CD4+ cells: Foxp3 vs. tetramer staining after gating on total CD4+ T cells, or on CD25hi CD127− or CD25− CD127+ among CD4+ T cells (Control group shown). Shown in green is the percentage of Foxp3+ cells within Tet+ T cells. (B) Flow cytometry analysis showed percentage of Tet+ Tregs (Foxp3+ CD25hi CD127−) among CD4SP and DP cells in thymic graft, or CD4+ T cells in spleen and lymph nodes [mean ± SEM, Control group (open circles) n = 6; Peptide group (filled circles) n = 7].

