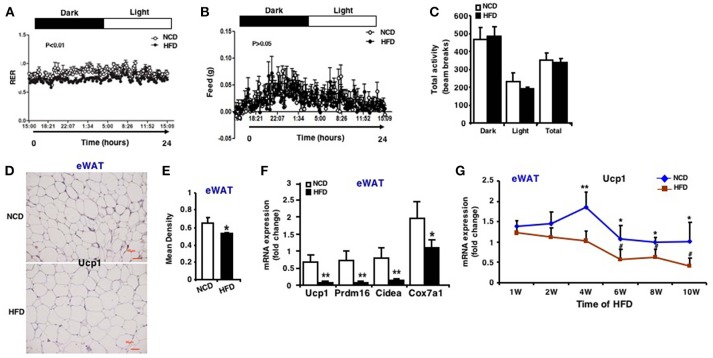
Figure 3.
Impaired browning ability of eWAT in HFD induced obese mice. Whole body-energy metabolism analysis was measured after 13-week HFD feeding. (A) Respiratory Exchange Rate (RER). (B) Food intake. (C) Physical activity (n = 6). Mice were sacrificed after 13-week HFD feeding. (D) Representative immunohistochemical staining for Ucp1 in eWAT (n = 6). Scale bars: 50 μm. (E) Representative Ucp1 staining intensity designated by mean densitometry of the digital image (n = 6). (F) qRT-PCR analysis of Ucp1 expression and other brown adipose-selective genes in eWAT (n = 10–12). (G) qRT-PCR analysis of Ucp1 expression in eWAT at the 1st, 2nd, 4th, 6th, 8th, and 10th week after HFD. Data are shown as mean ± SEM, n = 6. *p < 0.05; **p < 0.01, NCD vs. HFD; #p < 0.05, 2nd, 4th, 6th, 8th, or 10th week vs. 1st week in the HFD group.

