Figure 1.
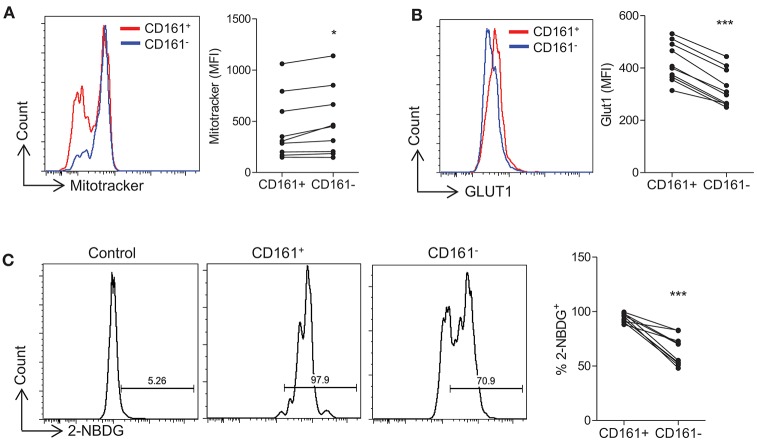
Th17-lineage cells show increased expression of glycolytic markers compared with non-Th17 cells. PBMC were isolated from healthy controls and cells were stained ex vivo with fluorochrome-conjugated antibodies specific for CD4, CD45RO, CD161, and MitoTracker® Green. The expression of MitoTracker® Green in CD4+CD45RO+CD161+ (CD161+) and CD4+CD45RO+CD161− (CD161−) (n = 9) (A). Memory CD4+ T cells were isolated from HC by magnetic separation and stimulated in the presence of anti-CD3 and irrAPC. Cells were stained with fluorochrome-conjugated antibodies specific for CD4, CD161, Glut1, and 2-NBDG. The expression of Glut1 in CD4+ CD161+ (CD161+) and CD4+ CD161− (CD161−) (n = 10) at 24 h stimulation (B). The uptake of 2-NBDG in CD161+ and CD161− cells compared with unstimulated CD4+ T cells (control) (n = 10) at 72 h stimulation (C). *p < 0.05, ***p < 0.001.

