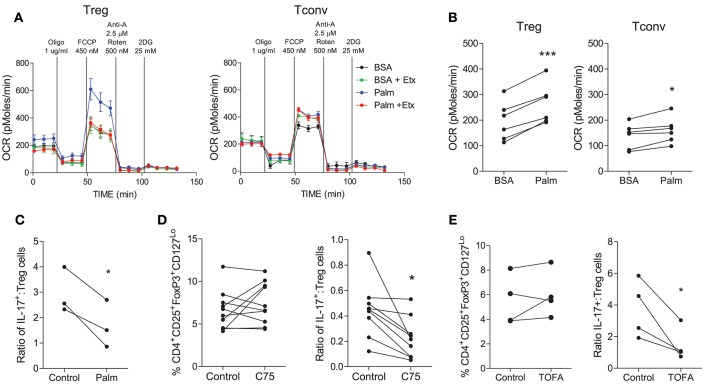
Figure 5.
Treg cells demonstrate increased oxidation of fatty acids compared with Tconv cells and are not reliant upon fatty acid synthesis. Treg (CD4+CD25+CD127Lo) and Tconv (CD4+CD45RO+NotCD25+CD127Lo) cells were cell sorted from PBMC. Cells were cultured for 6 d in the presence of anti-CD3, irrAPC, and IL-2. Cells were stimulated for 18 h with PMA and ionomycin prior to Seahorse extracellular flux analysis. The Seahorse XF Palmitate-BSA FAO assay was performed to analyse the oxidation of fatty acids to fuel mitochondrial respiration. Representative plot of OCR over time for Treg and Tconv in the presence of BSA (BSA) or palmitate (Palm) and in the presence or absence of etomoxir (Etx) (A). OCR for Treg and Tconv in the presence of BSA control or palmitate (n = 6) (B). Memory CD4+ T cells were isolated by magnetic separation and cultured for 5 d in the presence of anti-CD3 and irrAPC in glucose-free medium supplemented with galactose in the presence or absence of palmitate (Palm). The ratio of IL-17+ to Treg cells is shown (C). Memory CD45RO+CD4+ T cells were cultured for 5 d with anti-CD3 and irrAPC in the presence or absence of TOFA or C75 and stained directly for Treg markers CD4, CD25, CD127, and FoxP3, or re-stimulated with PMA and ionomycin and stained for IL-17, CD3, and CD8 and analyzed by flow cytometry (gated on live, single CD3+CD8− cells). The frequencies of Treg cells, and the ratio of IL-17+ to Treg cells following culture with TOFA (n = 4) (D) or C75 (n = 9) (E). *p < 0.05, ***p < 0.001.

