Figure 2.
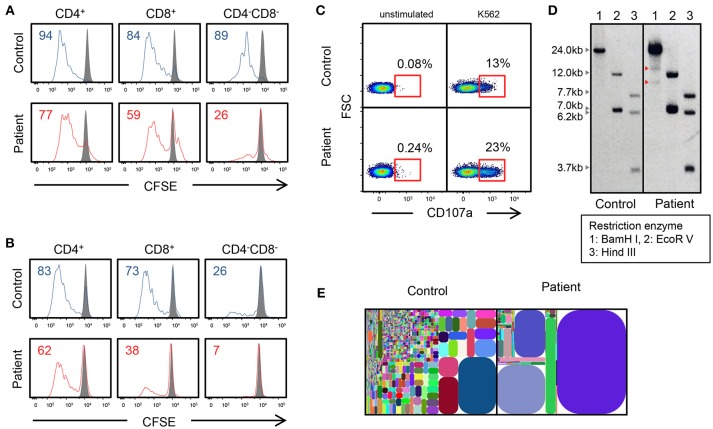
Genetic and immunological studies 2. (A,B) Proliferation assay of CD4+, CD8+, and CD4−CD8− cells using CSFE after PHA and IL-2 stimulation and anti-CD3/CD28 stimulation. (C) CD107a expression of CD3−CD56+ NK cells, which were cultured with K562 target cells. Cells are gated on CD3−CD56+ cells. (D) Southern blot analysis of TCRβ chain. The patient shows extra bands (red arrowhead). (E) T-cell γ receptor repertoire.

