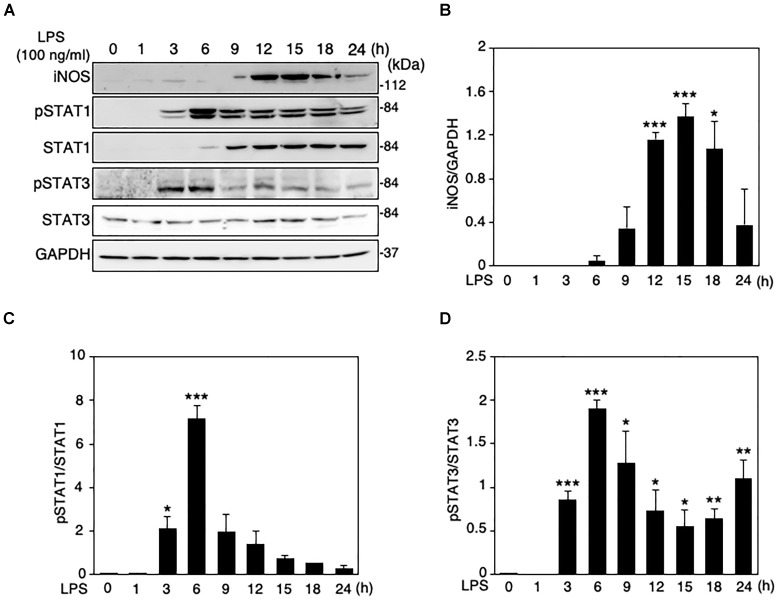
FIGURE 1.
Changes in protein expression levels of iNOS and total and phosphorylation levels of STAT1 and STAT3 in LPS-stimulated MG6 cells. (A) Typical Western blots of iNOS, phospho-STAT1 at Tyr-701, total STAT-1, phospho-STAT3 at Tyr-705, and total STAT-3 after challenge with 100 ng/ml LPS. GAPDH served as loading control. (B) Time course of changes in iNOS protein expression after LPS application. (C) Time course of changes in STAT1 phosphorylation after LPS application. (D) Time course of changes in STAT3 phosphorylation after LPS application. The results represent the mean ± SEM for three independent experiments. ∗P < 0.05, ∗∗P < 0.01, and ∗∗∗P < 0.001 vs. time 0 by t-test.

