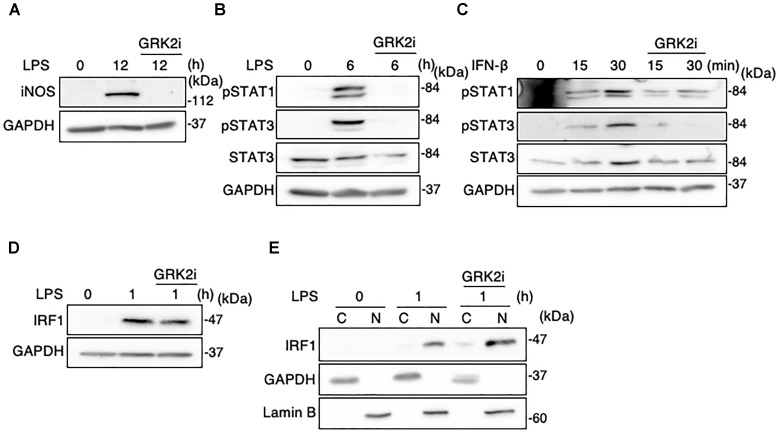
FIGURE 10.
Effect of GRK2 inhibitor treatment on iNOS expression, STAT1/3 activation, and IRF1 activation in microglial cells. GRK2 inhibitor at a concentration of 10 μM was added at 30 min before challenge with 100 ng/ml LPS or 10 ng/ml IFN-β. (A) Expression of iNOS protein before and 15 h after LPS application. (B) STAT1 and STAT3 phosphorylation before and 6 h after LPS application. (C) STAT1 and STAT3 phosphorylation before and 15–30 min after IFN-β supplementation. (D) Expression of IRF1 expression before and 1 h after LPS application. (E) Cytoplasmic (C) and nuclear (N) fractions were isolated, and then changes in IRF1 levels in each fraction before and 1 h after LPS application was tracked by Western blot analysis. GAPDH served as loading control and lamin B was used as a nuclear marker. Shown are representative Western blots from three independent experiments in which the same results were obtained.

