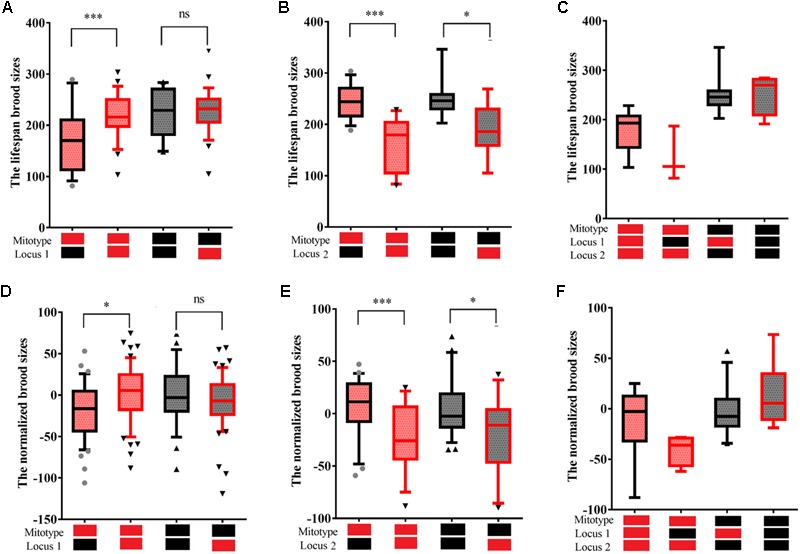
FIGURE 4.

Fecundity of RIAILs C. elegans. Box plots show summary phenotype data of the RIAILs that carried different mitochondria or genotypes at one of two loci on the chromosomes [Bristol in black (N2) and Hawaii in red (CB4856)]. Lifespan brood sizes were counted by standard laboratory agar plate assays (A–C). Normalized brood sizes of the RIAILs C. elegans were counted by high-throughput assays of nematodes grown in 96-well microtiter plates (D–F) and from data downloaded from previously published dataset (Andersen et al., 2015). Data shown are the median (10–90% percentile). ∗P < 0.05, ∗∗∗P < 0.001, Student’s t-test.
