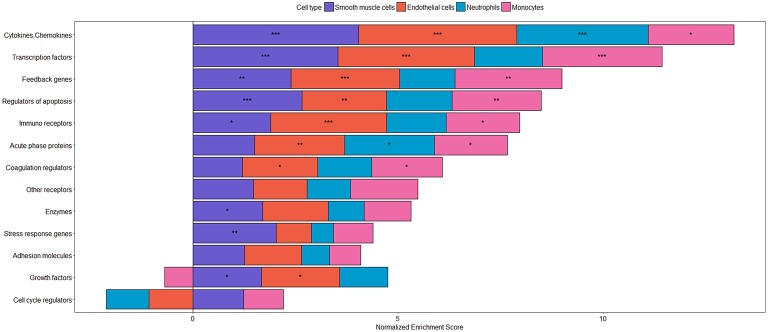
Figure 4.
Categories of inflammatory target genes in different cell types. Transcriptional responses after stimulation with TNFα have been analyzed using gene set enrichment analysis (GSEA) with the following datasets: smooth muscle cells: GSE96962; endothelial cells: GSE96962; monocytes: GSE56681; neutrophils: GSE40548. Gene sets were derived from NF-κB target genes as described in Jia et al. (207). As p-value and log fold change (LogFC) are often used to evaluate significant results from differential expression analysis and the up-regulated/down-regulated genes are usually at the top and/ bottom of the ranked gene list, respectively, we used the signed z-value to rank genes, where the sign is from LogFC, as previously described (208). To assess the enrichment of the target genes of NF-kappa B gene sets in the different datasets, the GSEA Preranked tool was used (209). Gene sets showing a significant enrichment are represented by ***(FDR < 0.001), **(FDR < 0.01), and *(FDR < 0.05). The plot was produced using the R package, ggplot2 (210) visualizing the normalized enrichment scores as stacked bars showing differences in the response between different cell types of the vasculature and circulation.

