Fig. 2.

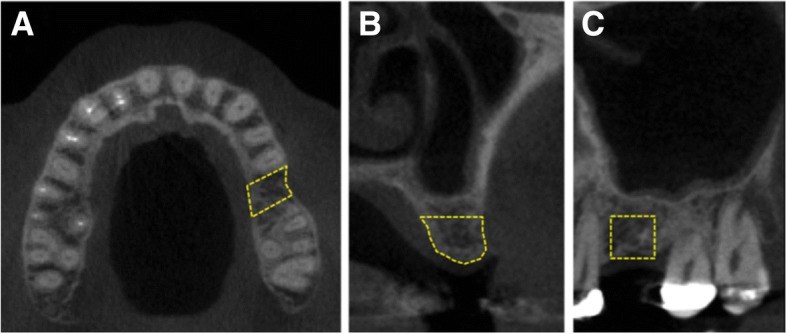
Preoperative CT image showing the site for the definition of the ROI (simulated area delimited by a yellow dashed line for illustration purpose) in the axial (a), coronal (b), and sagittal (6 × 6 mm) (c) sections

Preoperative CT image showing the site for the definition of the ROI (simulated area delimited by a yellow dashed line for illustration purpose) in the axial (a), coronal (b), and sagittal (6 × 6 mm) (c) sections