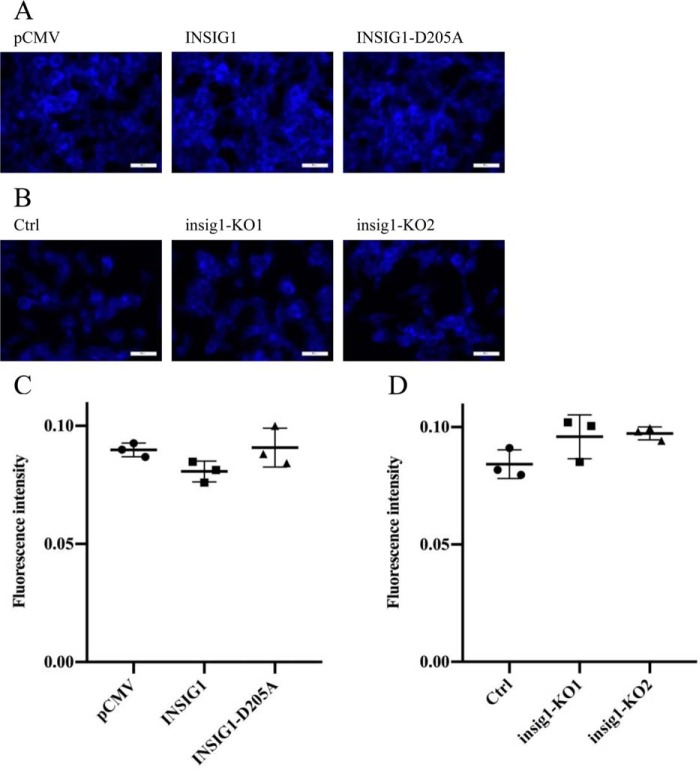
Figure 11.
Presence or absence of INSIG1 did not lead to significant change in cholesterol content in 293T. A, 293T cells were transfected with empty vector, INSIG1, or INSIG1-D205A, and stained with filipin 48 h later. Stained cells were imaged by a fluorescence microscope. Scale bars, 50 μm. B, insig1 knockout 293T cells were stained with filipin. Stained cells were imaged by a fluorescence microscope. Scale bars, 50 μm. C, fluorescence intensity of filipin in stained cells in A was quantified by ImageJ. Shown is mean ± S.D. (error bars) from three independent experiments. D, fluorescence intensity of filipin in stained cells in B was quantified by ImageJ. Shown is mean ± S.D. from three independent experiments.

