Figure 5.
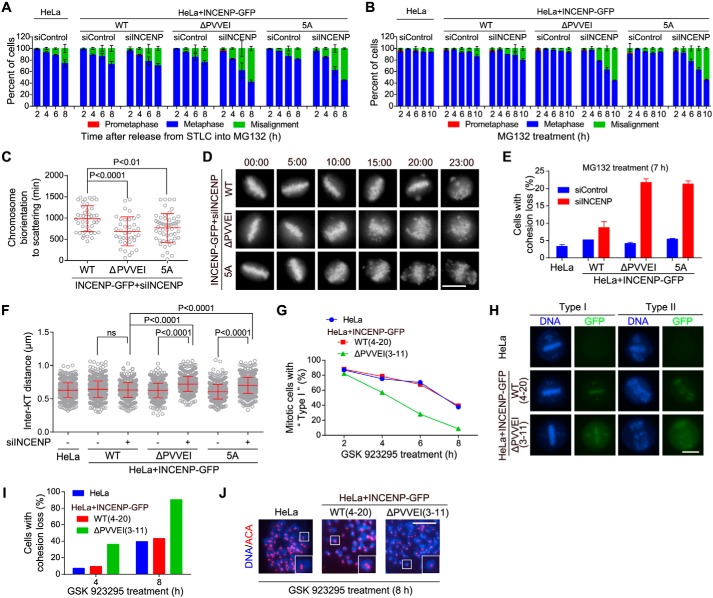
Disrupting the INCENP–HP1 interaction weakens centromeric cohesion. A, HeLa cells and the indicated stable cell lines transfected with control or INCENP siRNA were released from 5-h treatment with STLC into MG132-containing medium and then fixed at the indicated time points for DNA staining. The percentage of mitotic cells in prometaphase, metaphase, and metaphase with some misaligned chromosomes was determined in around 200 cells (n = 2). B, cells transfected as in A were exposed to MG132, then fixed at the indicated time points for DNA staining, and quantified in around 200 cells (n = 2). C and D, the indicated INCENP-GFP cell lines stably expressing H2B-GFP were exposed to MG132 and subjected to live imaging. The time from the achievement of metaphase chromosome alignment to chromosome scattering was determined in at least 37 cells (C). Selected frames of the movies are shown (D). Time stated in hours:minutes. E, cells transfected as in A were exposed to MG132 for 7 h. Using mitotic chromosome spreads, the percentage of cells with cohesion loss was determined in 100 cells (n = 2). Example images are shown in Fig. S4D. F, cells transfected as in A were treated with nocodazole for 3 h. Mitotic chromosome spreads were stained with ACA and DAPI. The inter-KT distance was measured on over 802 chromosomes in 20 cells. G and H, HeLa cells in which endogenous INCENP was stably replaced by exogenous INCENP-GFP (WT and the indicated mutant) were treated with GSK 923295 and then fixed at the indicated time points for DNA staining. The percentage of mitotic cells with mild (Type I) or severe (Type II) chromosome misalignment was determined in around 150 cells. I and J, mitotic cells treated as in G were collected to prepare chromosome spreads. The percentage of cells with cohesion loss was determined in around 100 cells (I). Example images are shown (J). Means and error bars representing S.D. are shown (unpaired t test). Scale bars, 10 μm. See also Fig. S4. ns, not significant.

