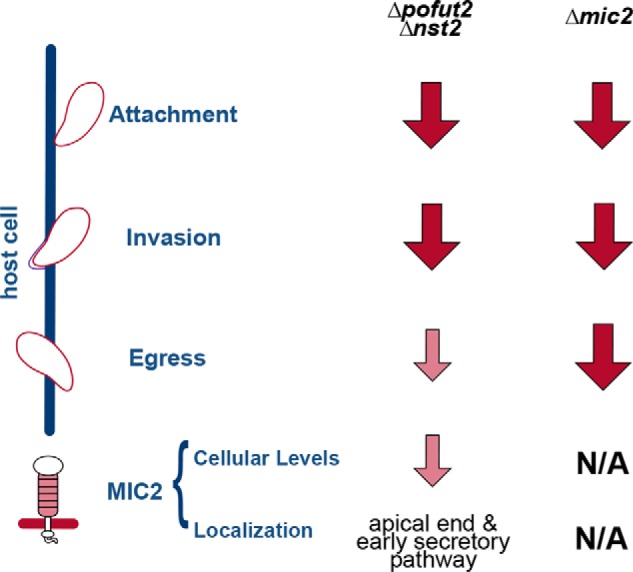
Figure 10.

Comparison of mic2 and O-fucosylation KOs. Shown is a schematic representation of differences and similarities between Δmic2 and Δpofut2 and Δnst2. Disruption of O-fucosylation is sufficient to reproduce the attachment and invasion defects observed when MIC2 is not being synthesized. Conversely, the parasite ability to egress is much more compromised in the Δmic2 versus Δpofut2 and Δnst2. Dark red arrows indicate a stronger defect, whereas small light red arrows indicate a milder phenotype. N/A, not applicable.
