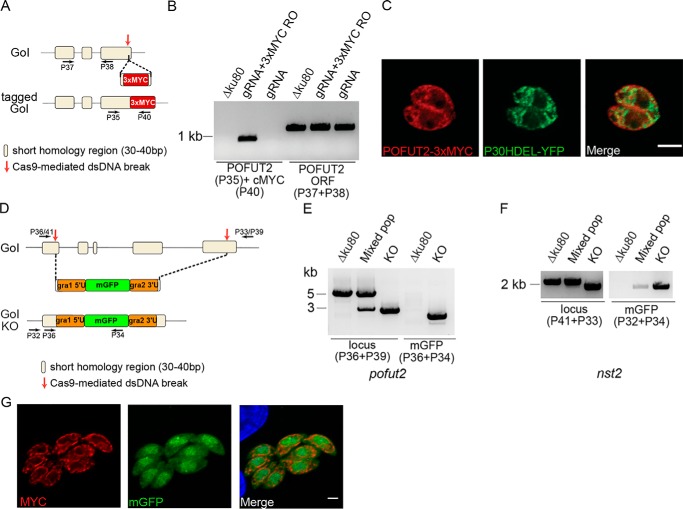
Figure 4.
Localization of POFUT2 and generation of Δpofut2 and Δnst2 mutants. A, schematic representation of the strategy used to in situ tag pofut2 and the regions recognized by the primers used in B. B, PCR to show integration of the 3xMYC tag in the correct locus (P35 + P40). A control reaction amplifying a fragment of the pofut2 ORF was also performed (P37 + P38). C, IFA of RH ΔKu80 tachyzoites expressing pofut2 tagged at the C terminus with a 3xMYC tag and an ER marker (p30HDEL-YFP) shows partial co-localization. Scale bar, 2 μm. D, schematic representation of the strategy used to generate the pofut2 and nst2 gene disruptions. Cas9 was directed to excise each gene in the first and last exon. An mGFP-expressing cassette was inserted in each locus. The primers used in E and F are marked by arrows. E and F, genomic DNA was extracted after a first enrichment for mGFP-positive cells (mixed population) and after the final cloning step (KO). PCR analyses show substitution of the WT ORF with the mGFP cassette in both strains. Mixed pop, mixed population. All primer sequences can be found in Table S2. G, Δpofut2 parasites were complemented by expression of T. gondii POFUT2 fused to a 3xMYC C-terminal tag. MYC staining by IFA is consistent with ER localization. Scale bar, 2 μm.

