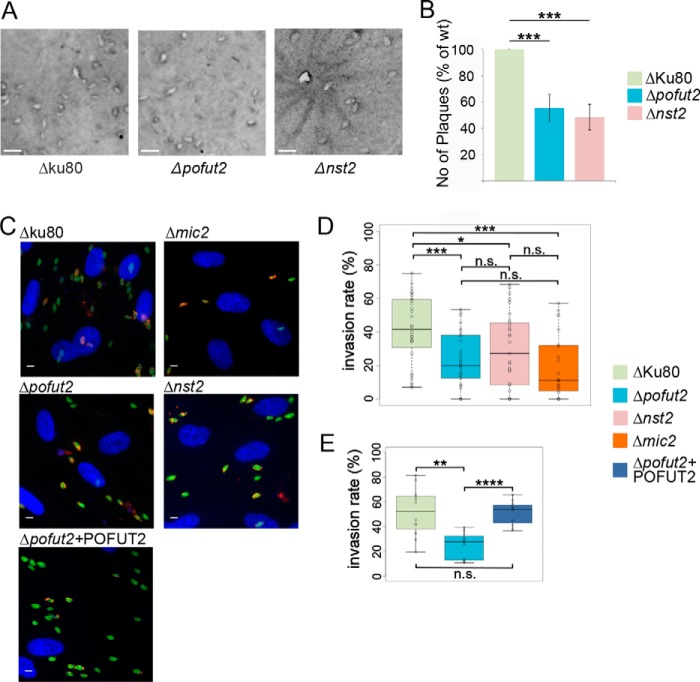
Figure 8.
Growth, attachment, and invasion are affected in Δpofut2 and Δnst2. A, representative images from the plaque assay. Scale bars, 2 mm. B, quantification of the number of plaques shows a 40% reduction plaque formation in the KOs compared with the parental strain. The average of four biological repeats ± S.D. (error bars) is shown. ***, p < 0.0005. C, representative images from the red/green invasion assays. Attached parasites look yellow (red + green), and invaded parasites are green. D, box plot for the red/green assay, comparing the invasion rate between parental lines and mutants (ratio of invaded to total parasites). E, box plot for the red/green assay, comparing the invasion rates between parental strain, Δpofut2, and the complemented parasites (Δpofut2 + POFUT2). Student's t test was used to compare the samples. and significant differences are marked: *, 0.05 < p < 0.01; **, p < 0.001; ***, p < 0.0005; ****, p < 0.00001. All p values are reported in Table S3. Scale bars, 5 μm.

