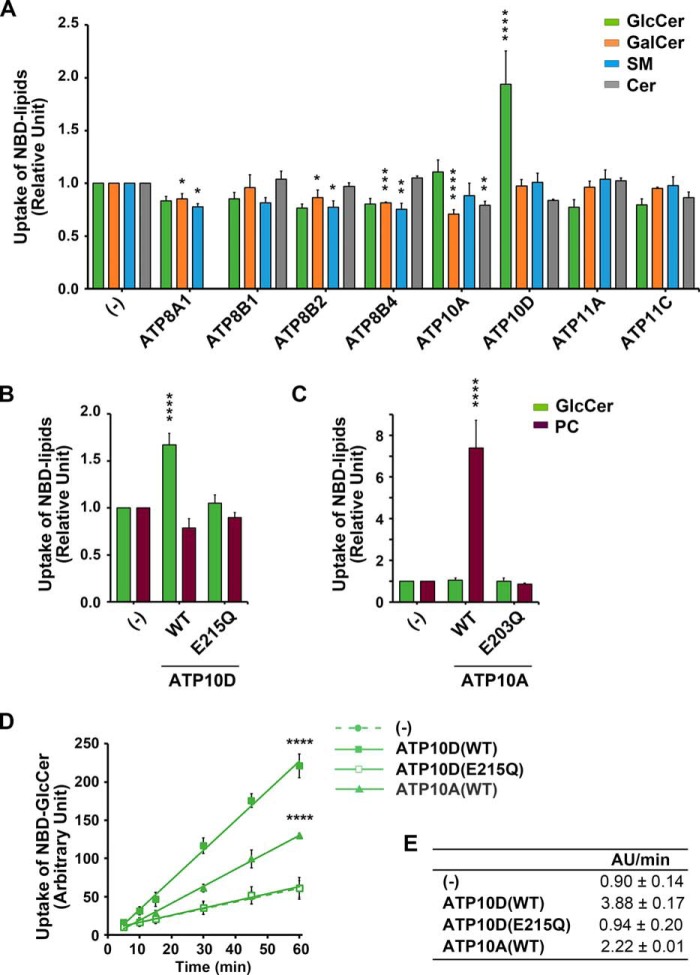
Figure 2.
H. sapiens ATP10A and -10D translocate NBD-GlcCer at the plasma membrane. A–C, parental HeLa cells (−) and cells stably expressing human P4-ATPases and mutants were incubated with the indicated NBD-lipids at 15 °C for 15 min. After extraction with fatty acid–free BSA, the residual fluorescence intensity associated with the cells was determined by flow cytometry. Graphs display averages from 3–4 independent experiments ± S.D. (error bars). -Fold increase of NBD-lipid uptake compared with parental cells (−) is shown. A one-way ANOVA was performed to assess variance in A–C, and comparisons with parental cells (−) were made with Tukey's post hoc analysis. D, HeLa cells were incubated with NBD-GlcCer at 15 °C for the indicated times (x axis). E, velocities of GlcCer transport from linear regression fits of data in D (AU, arbitrary units), ± S.D. Graphs display averages from three independent experiments ± S.D. A two-way repeated measures ANOVA was used to assess variance in the kinetic data, and comparisons with parental cells (−) were made with Tukey's post hoc analysis: *, p < 0.05; **, p < 0.01; ***, p < 0.001; ****, p < 0.0001.

