Figure 1.
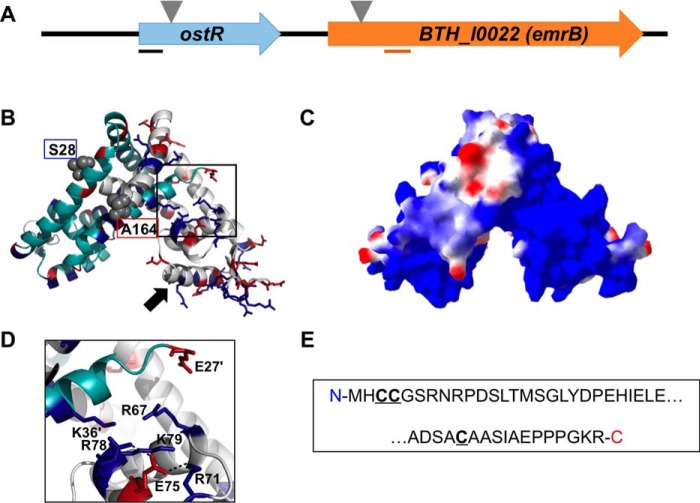
Burkholderia thailandensis OstR. A, ostR-emrB genomic locus. Transposon insertion is indicated by inverted triangles. Lines below the arrows illustrating open reading frames represent the positions of PCR amplicons used for quantitative RT-PCR. B, predicted model of OstR based on template 4AIK, created by SwissModel (in automated mode; GMQE 0.55) and visualized by PyMOL. One monomer is shown in cyan and the other is in gray, with positively charged residues in blue and negatively charged amino acids in red. Serine at position 28 and alanine at position 164 (marking the range of amino acids included in the model) are shown in space-filling representation. Black arrow, DNA recognition helix. C, electrostatic surface potential was calculated using Swiss PDB Viewer (red, negative; blue, positive). D, magnified image of the positively charged patch. E, N- and C-terminal extensions of OstR that are not included in the modeled structure, with cysteines in boldface type and underlined.

