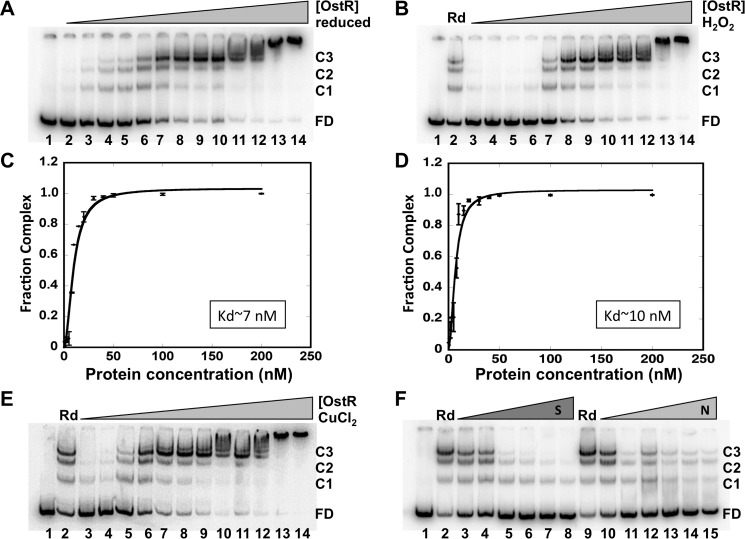
Figure 6.
OstR binds emrB promoter DNA. A, EMSA showing reduced OstR binding emrB promoter DNA (0.2 nm). DNA was titrated with increasing concentration of OstR (1–200 nm; lanes 2–14). Lane 1, free DNA only. Free DNA and protein–DNA complex are shown as FD and C1–C3, respectively, at the right. B and E, EMSA showing oxidized OstR binding emrB promoter DNA. Reactions in lanes 1 contained free DNA only, and reactions in lanes 2 contained reduced OstR. Lanes 3–14, operator DNA (0.2 nm) titrated with increasing concentration (1–200 nm) of oxidized protein (oxidized with 2 mm H2O2 and 5 μm CuCl2, respectively). Normalized complex fraction for reduced OstR (C) and normalized complex fraction for H2O2-oxidized OstR (D) are plotted as a function of OstR concentration. S.D. values of three replicates are represented as error bars. F, EMSA showing OstR (5 nm) bound to 0.2 nm labeled operator DNA challenged with increasing concentration of specific unlabeled 146-bp operator DNA (0.2–50 nm, lanes 3–8) or nonspecific DNA pET28b (0.2–10 nm, lanes 10–15). The reaction in lane 1 contained free DNA only; the reactions in lanes 2 and 9 contained no competitor DNA.

