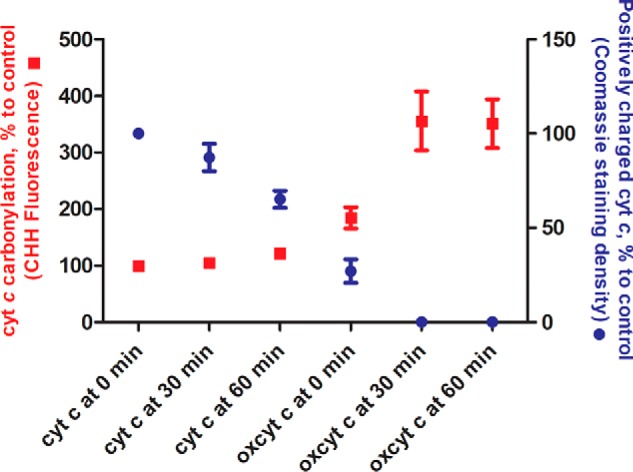
Figure 9.

Cyt c carbonylation and associated loss of positive charge upon oxidation with hydrogen peroxide. Cyt c (100 μm) was incubated in the absence or presence of H2O2 (1 mm) for 0, 30, and 60 min. Protein carbonylation (left axis, red) was quantified relative to control (cyt c incubated in the absence of hydrogen peroxide for 0 min) using derivatization with the carbonyl-specific fluorescence dye CHH and SDS-PAGE separation. Reduction of cyt c positive charge (right axis, blue) was quantified relative to control (cyt c incubated in the absence of hydrogen peroxide for 0 min) using native PAGE performed in reverse electrophoresis mode. Data are expressed as mean (points) ± S.E. (error bars) (n = 3).
