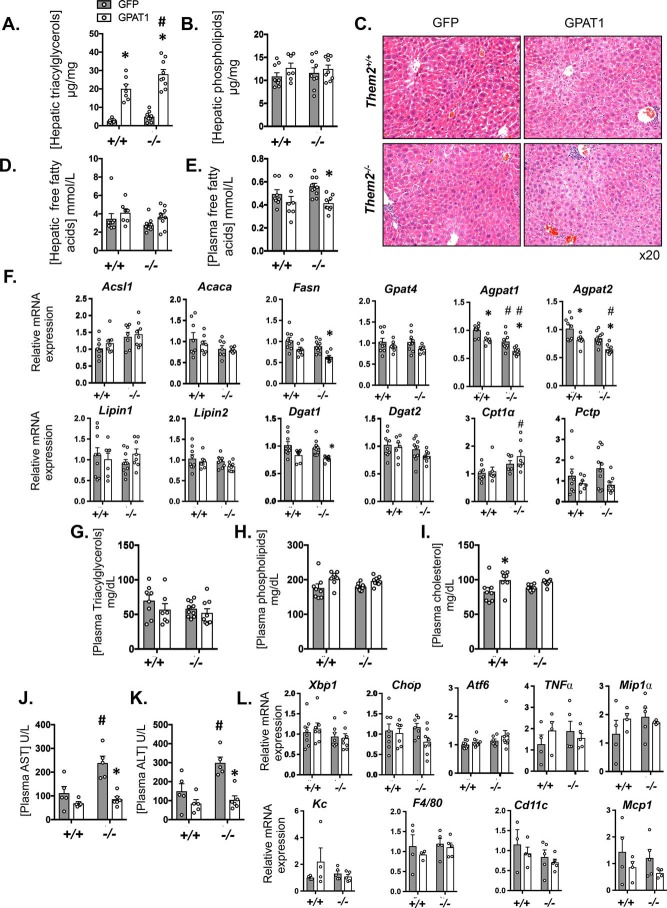
Figure 2.
Liver-specific GPAT1 overexpression promotes steatosis irrespective of Them2 expression. A and B, hepatic concentrations of TAG (A) and phospholipids (B) (n = 7–10/group). C, representative hematoxylin and eosin–stained liver sections from adenovirus-treated mice. D and E, free fatty acid concentrations in liver (D) and plasma (E). F, mRNA expression of selected genes in liver that regulate lipogenesis, triacylglycerol synthesis, and fatty acid oxidation (n = 7–10/group). Values are relative to expression in Them2+/+ Ad-GFP. G–I, plasma concentrations of triacylglycerols (G), phospholipids (H), and cholesterol (I) (n = 7–10/group). J and K, plasma activities of AST (J) and ALT (K) (n = 5–6/group). L, mRNA expression of ER stress–related genes (n = 7–10/group) and inflammatory genes (n = 4–5/group) in liver. Values represent mean ± S.E. (error bars) Differences were detected by post hoc testing following two-way ANOVA. *, p < 0.05, GFP versus GPAT1; #, p < 0.05, Them2+/+ versus Them2−/−.

