Figure 4.
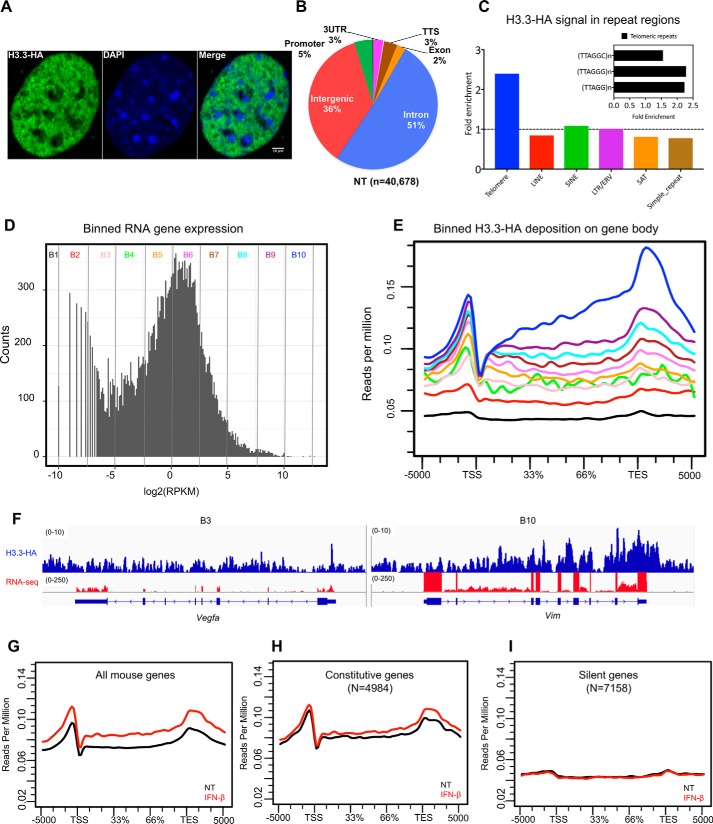
Genome-wide H3.3 distribution: ChIP-seq analysis with anti-HA antibody. A, confocal image of H3.3 distribution in the MEF nucleus. MEFs from H3f3b-HA mice were stained with HA antibody (green) and counterstained with 4′,6′-diamino-2-phenylindole (blue). The white vertical bar indicates 10 μm. B, pie chart depicting genomic distribution of H3.3 peaks (%). TTS, transcription termination site; NT, no treatment. C, H3.3-HA enrichment at various repetitive elements. The levels of H3.3 at the telomeric regions (TTAGGG)n, long interspersed elements (LINE), short interspersed elements (SINE), long terminal repeats (LTR), satellite regions (SAT), and simple repeats were calculated by dividing the reads of HA immunoprecipitated sample and the corresponding input sample. The enrichments were calculated using the RepEnrich2 software (36) (https://github.com/nerettilab/RepEnrich2). (Please note that the JBC is not responsible for the long-term archiving and maintenance of this site or any other third party hosted site.) The fold enrichment on the y axis represents the number of reads in the HA sample over the input ChIP. The dotted line shows H3.3 signals that are more than 1-fold and above. The inset shows three different subclasses of telomeric repeat sequences and their fold enrichment over input samples. ERV, endogenous retrovirus. D, RNA-seq analysis. All annotated mouse genes were divided into 10 bins according to the transcript levels (log2, RPKM), and each bin contained equal number of genes (∼3000 genes) with the exception of B1 and B2, which had ∼7,000 genes and plotted as histogram. The y axis (counts) represents how many times mRNA expression occurred within the specified range of RPKM in each bin (Table S1 (Binned genes)). E, ChIP-seq analysis. Average H3.3 accumulation was plotted for genes in 10 bins for the genic regions (TSS, gene body, TES ± 5 kb). Numbers on the y axis represent reads per million. F, IGV screenshots for ChIP-seq peaks (blue) and RNA peaks (red). G–I, average H3.3 distribution patterns for all genes (G), constitutively expressed genes (H), and silent genes (I) are shown.

