Figure 5.
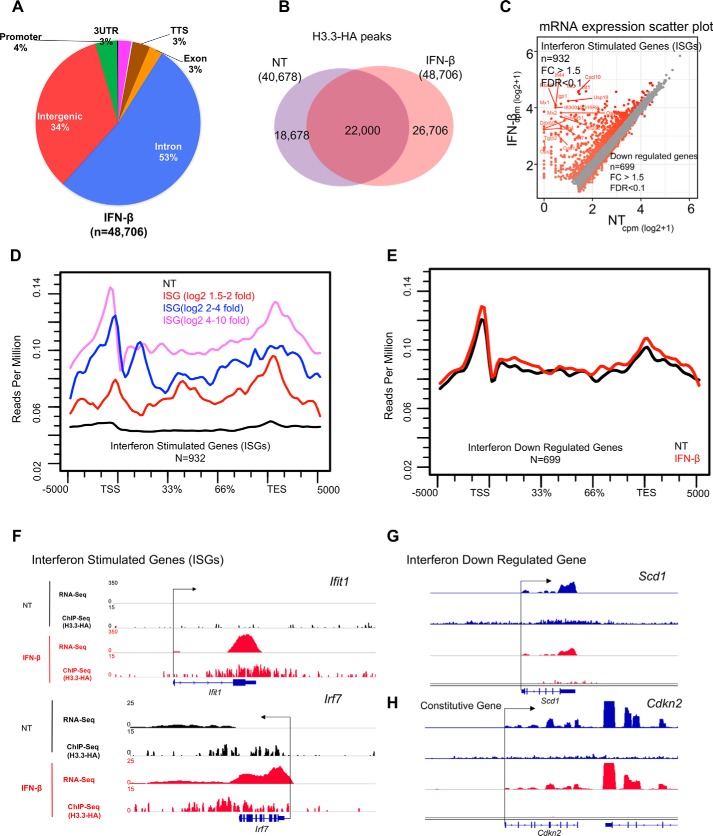
IFN triggers H3. 3 accumulation on ISGs. A, pie chart depicting genomic distribution of H3.3-HA peaks in MEFs treated with IFN (6 h) shown as percentages (%). B, Venn diagram showing the overlap of peak coordinates of total H3.3 peaks in untreated (NT) and IFN-treated cells. C, scatter plot showing genes up-regulated (932 genes) or down-regulated (699 genes) after IFN treatment. Genes with >1.5-fold difference (FDR, 0.1) were identified as ISGs or genes down-regulated by IFN treatment. D, average H3.3 accumulation was plotted for ISGs according to activation levels (high, intermediate, or low). NT (black) represents average H3.3 accumulation in untreated for all ISGs or down-regulated IFN. E, average H3.3 accumulation was plotted for IFN down-regulated genes both during NT- (black) and IFN- (red) treated conditions. F–H, IGV screenshots of RNA expression (RPKM) and H3.3-HA sequence depth normalized tag density on ISGs (Ifit1, Irf7), down-regulated gene (Scd1), and constitutively expressed gene (Cdkn2) in untreated (black) and IFN-treated cells.

