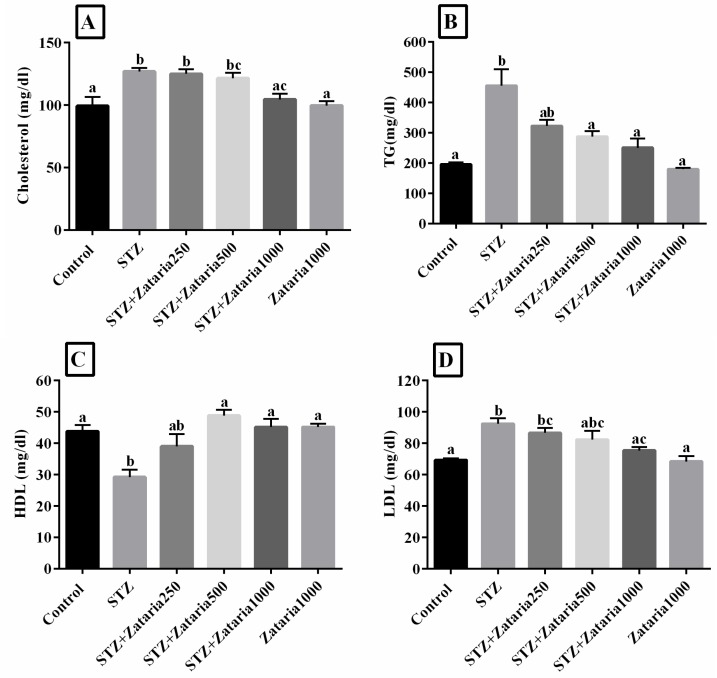
Figure 1.
Evaluation of lipid profile in experimental groups. Figure A-D: Control: healthy control; STZ: Streptozotocin 60 mg/kg; STZ+Zataria 250 mg/kg: streptozotocin+ Zataria multiflora 250 mg/kg; STZ+Zataria500mg/kg: streptozotocin+ Zataria multiflora 500 mg/kg; STZ+Zataria 1000 mg/kg: streptozotocin+ Zataria multiflora 1000 mg/kg; Zataria 1000 mg/kg: Zataria multiflora 1000 mg/kg
a, b, and c: According to post-hoc Tukey test which was used to make intergroup comparisons, groups with same superscripts were not significantly different at α=0.05 (p≥0.05). However, dissimilar letters indicate a significant difference (p<0.05).

