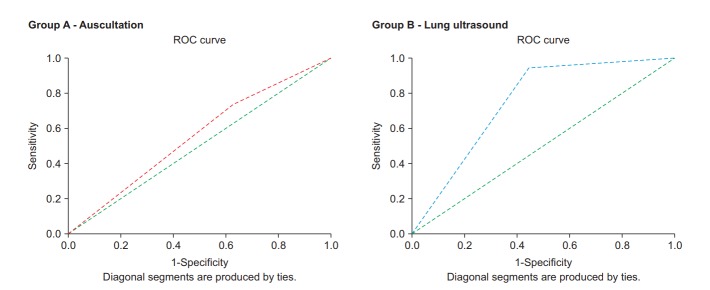
Fig. 2.
Receiver operating characteristic (ROC) curves for the two groups. Area under curve (AUC) for group B (0.748 with standard error 0.074; 95% CI, 0.604–0.893) was higher than AUC for group A (0.554 with standard error 0.089, 95% CI, 0.379–0.730), but this difference was not significant (P =0.109).

