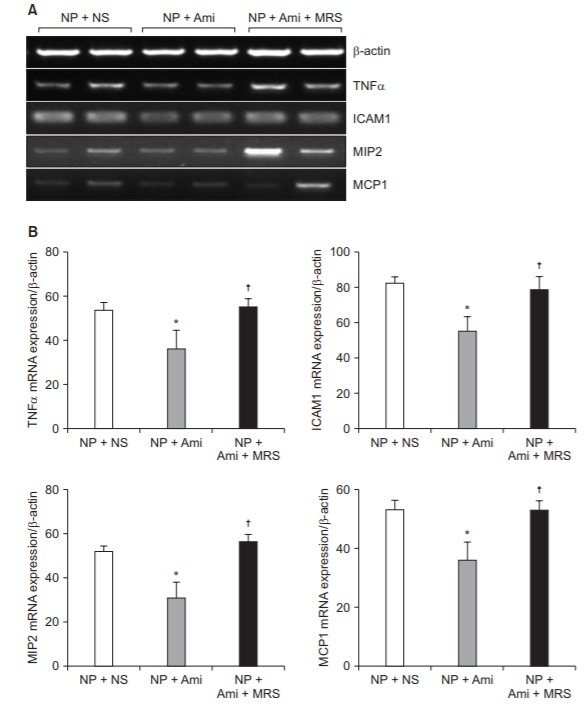
Fig. 3.

Comparison of the amount of proinflammatory cytokines between groups. (A) Representative RT-PCR images for TNF-α, ICAM-1, MIP-2, and MCP-1 from a spinal cord subjected to the NP+NS treatment (n = 8), NP + Ami treatment (n = 8), and NP + Ami + MRS treatment (n = 8). Representative of 3–5 experiments. β-actin is included to control for mRNA input. (B) Densitometric quantifications of band intensities for TNF-α, ICAM-1, MIP-2, and MCP1 from a spinal cord subjected to the NP + NS treatment (n = 8), NP + Ami treatment (n = 8), and NP + Ami + MRS treatment (n = 8). NP: neuropathic pain, NS: normal saline, Ami: amitriptyline, MRS: 3-ethyl-5-benzyl-2-methyl-4-phenylethynyl-6-phenyl-1,4-(±)-dihydropyridine-3,5-dicarboxylate. RTPCR: reverse-transcriptase polymerase chain reaction, TNF-α: tumor necrosis factor α, ICAM-1: intercellular adhesion molecule 1, MIP-2: macrophage inflammatory protein 2, MCP-1: monocyte chemoattractant protein 1. *P < 0.05 versus the NP + NS group, †P < 0.05 versus the NP + Ami group
