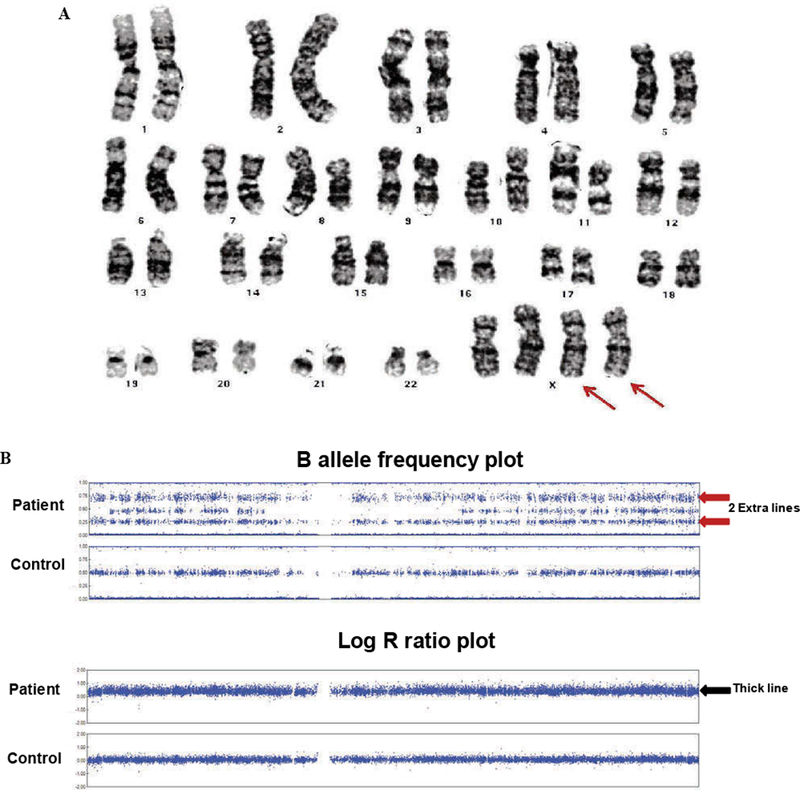
Figure 1.

Karyotype and SNP array. A) Karyotype showed 2 extra X chromosomes (red arrows). B) X chromosomes on SNP array shows 2 extra lines on B allele frequency plot (red arrows) compared to control showing heterozygous SNPs are separated into 3 distinct lines. The corresponding log R ratio plot shows a thicker line with higher log R ratio (black arrow) than control because extra chromosomes are calculated as duplication.
